Figure 3.

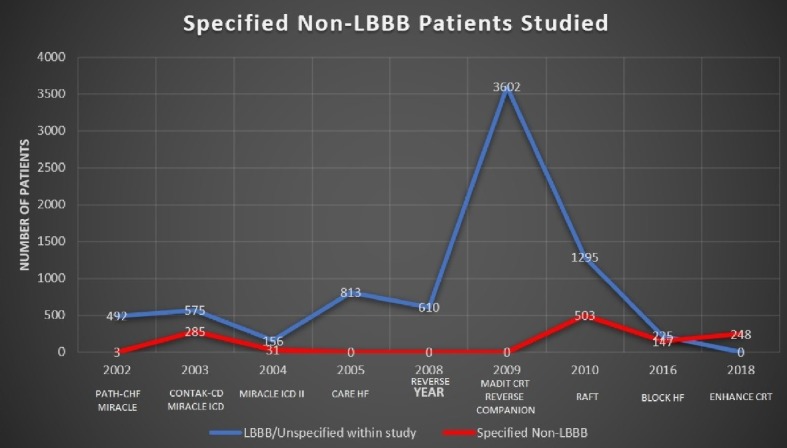
Line-graph representing the volume of patients studied over time, both LBBB/unspecified (blue) and specified non-LBBB (red). Only since 2016 can we see the gap beginning to narrow.

Line-graph representing the volume of patients studied over time, both LBBB/unspecified (blue) and specified non-LBBB (red). Only since 2016 can we see the gap beginning to narrow.