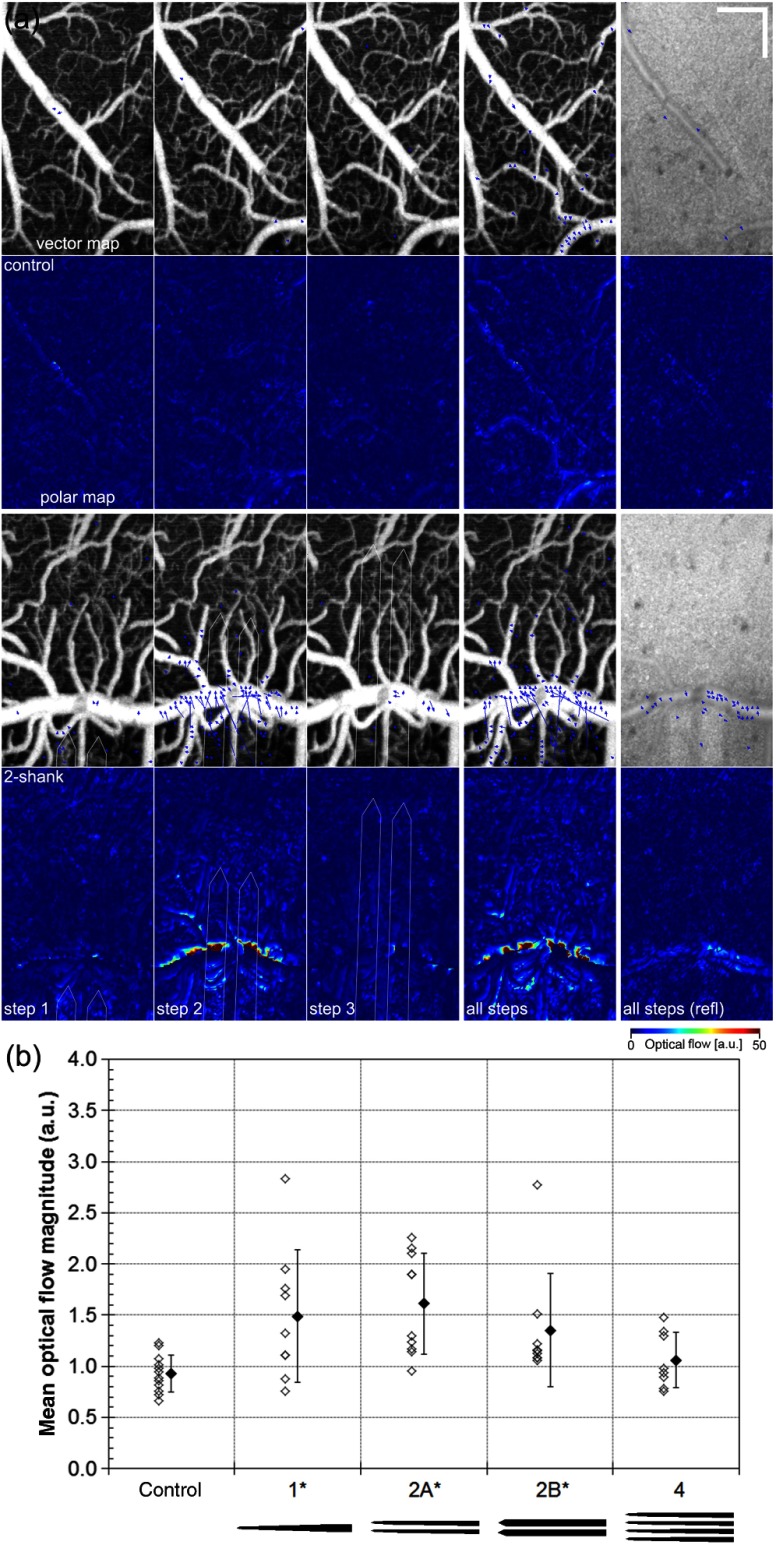
Fig. 6.
Optical flow of angiogram measures mechanical perturbation. (a) Example vector (overlaid on angiogram) and polar (magnitude) maps for control (top two rows) and 2-shank electrode insertion (third and fourth rows) for individual steps and all steps (baseline to last step) for depth slice 1 (0 to ). Shown for comparison are the vector and polar maps for the corresponding AIP reflectance images for all steps. . (b) Mean optical flow velocity magnitude across the ROI for all animals. Open symbols are values for each step in the animal group. Closed symbols are the mean values for the group. Error bars represent . between control and electrode groups. Electrode footprints are shown below graph (W74 and W87).

