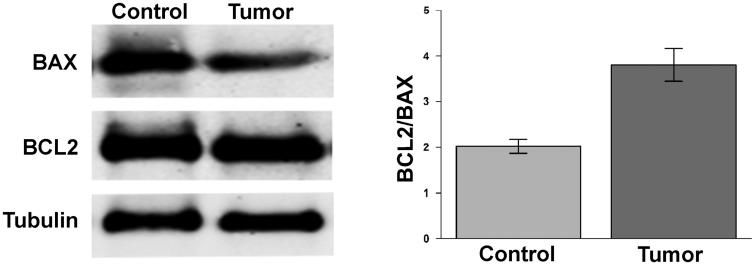
Figure 4.
Ratio BAX/BCL2 in ccRCC samples. Protein levels of BCL2 and BAX evaluated by WB in normal tissue (Control) and tumour sample (tumour) of a representative patient. Tubulin was used to normalise values in WB. In left panel are reported the ratio between the values of BCL2 versus BAX. Differences were significant for p ≤ .005.

