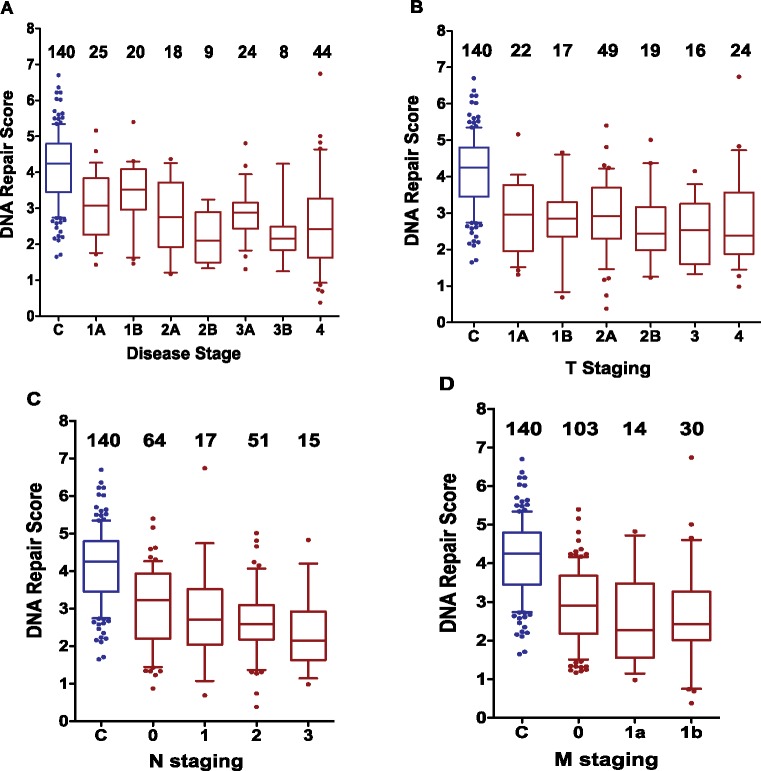
Figure 3.
Analysis of the DNA Repair scores by disease staging. The distributions of the DNA Repair scores are presented for the control individuals (C blue) and for the lung cancer patients by stage status (in red) using boxplots (whiskers 10th–90th percentile) showing the values lower than the first 10th percentile and greater than the 90th percentile as dots, with the line in the middle plotted at the median. Distributions are presented by disease state (A), T staging (B), N staging (C), and M staging (D). The number of participants in each subgroup is indicated above the plots. Importantly, the differences between the control groups and each of the earliest stagings in each category is statistically significant. C vs disease stage IA, P = .0009; C vs T1A, P = .011; C vs N0, P < .0001; C vs M0, P < .0001. All P values were adjusted for sex, age, and smoking status. See related numerical values in Supplementary Table 1 (available online), where the means and SDs are presented. The graphs were plotted using GraphPad Prism version 5.00 (GraphPad Software, San Diego, CA).

