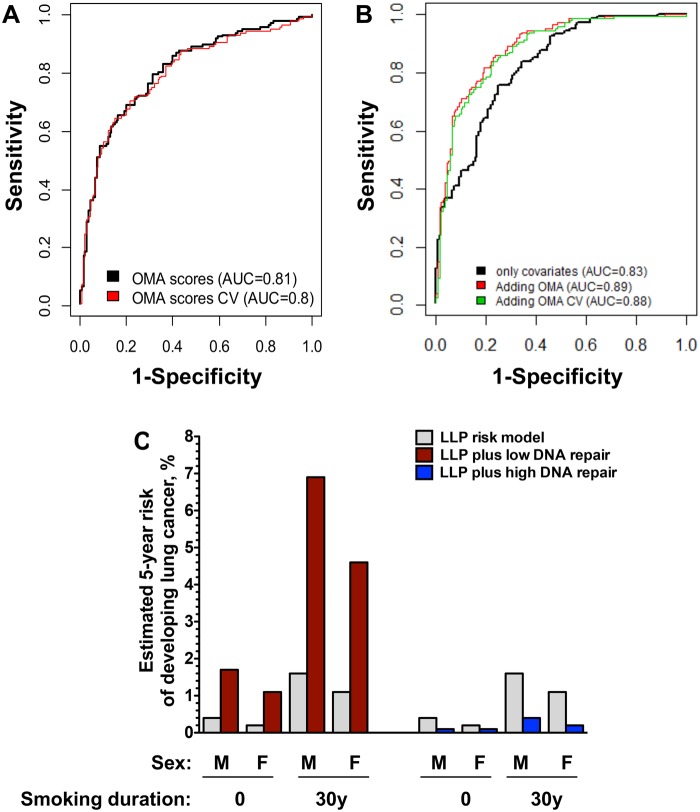
Figure 4.
Receiver operating characteristic (ROC) curve of the sensitivity and specificity of the DNA repair score in lung cancer risk and examples of its added value. A) ROC curve for the DNA repair scores obtained in the current study (black curve) and after cross-validation (red curve). B) ROC curve for the covariates age, sex, and smoking status (black curve) and after adding the DNA repair score to these basic covariates before (red curve) and after (green curve) cross-validation. C) Estimated added value of the DNA repair score to lung cancer risk estimates based on the Liverpool Lung Project (LLP) Risk Model. Estimates are presented for a man and a woman, age 65 years, who are either never smokers or smoked for 30 years. Gray columns represent the 5-year risk according to the Lung Project Risk model. The effect of having a low DNA repair score of 5th percentile or less (red columns), or a high DNA repair score of 75th percentile or greater (blue columns) are presented. Data were taken from Supplementary Table 4 (available online). APE1 = apurinic/apyrimidinic endonuclease 1; AUC = area under the curve; CV = cross-validated; F = female; M = male; MPG = methylpurine DNA glycosylase; OGG1 = 8-oxoguanine DNA glycosylase; OMA = OGG1, MPG, and APE1.

