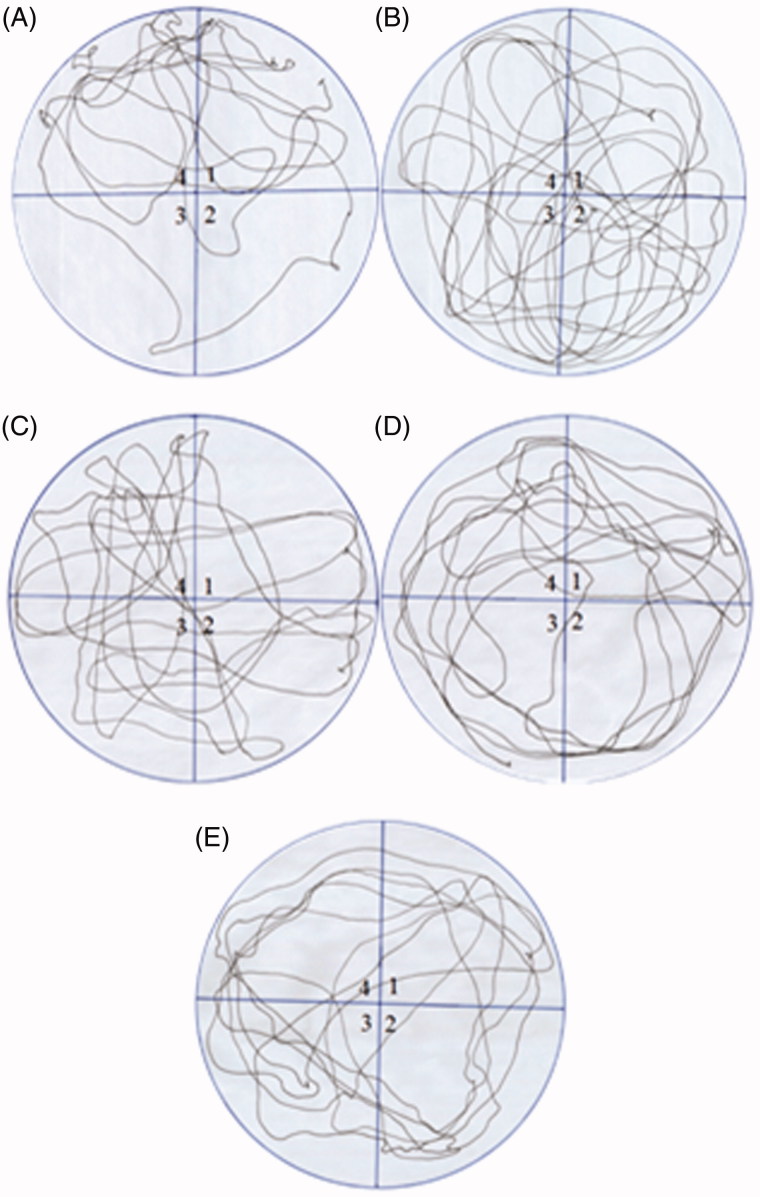
Figure 4.
Comparison of the movement pattern of different treatment groups in probe trial. Quadrant 1 was the starting quadrant while quadrant 4 was the target quadrant. (A) Movement pattern of the vehicle control group. (B) Movement pattern of the fructose group animals (treated with d-fructose 1000 mg/kg (i.p.) plus 10% in drinking water). (C), (D) and (E) are movement pattern of rats treated with GLA 1, 5 and 15 mg/kg, respectively.

