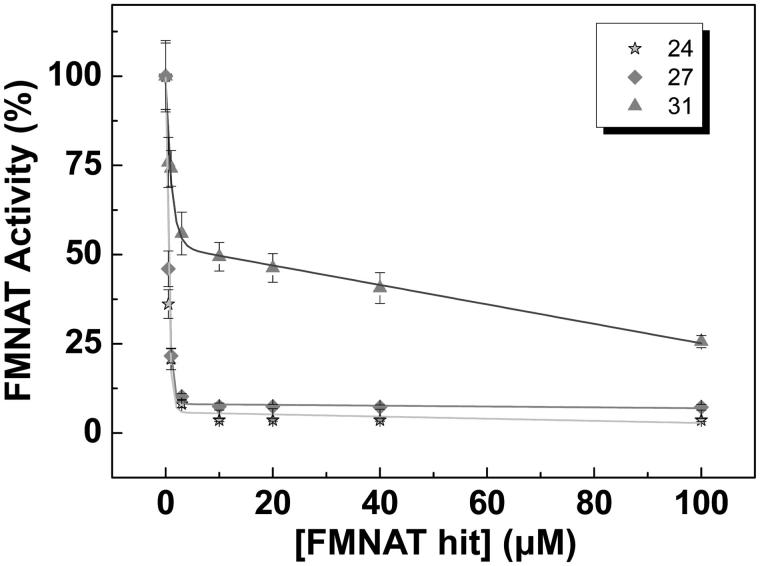
Figure 3.
Dose–response curves for the FMNAT activity of CaFADS in the presence of representative hits. Values derived from these representations are included in Table 2. Experiments performed at 25 °C in 20 mM PIPES, pH 7.0, 10 mM MgCl2, 2.5% DMSO, with 15 μM FMN and 350 μM ATP (n = 3, mean ± SD).

