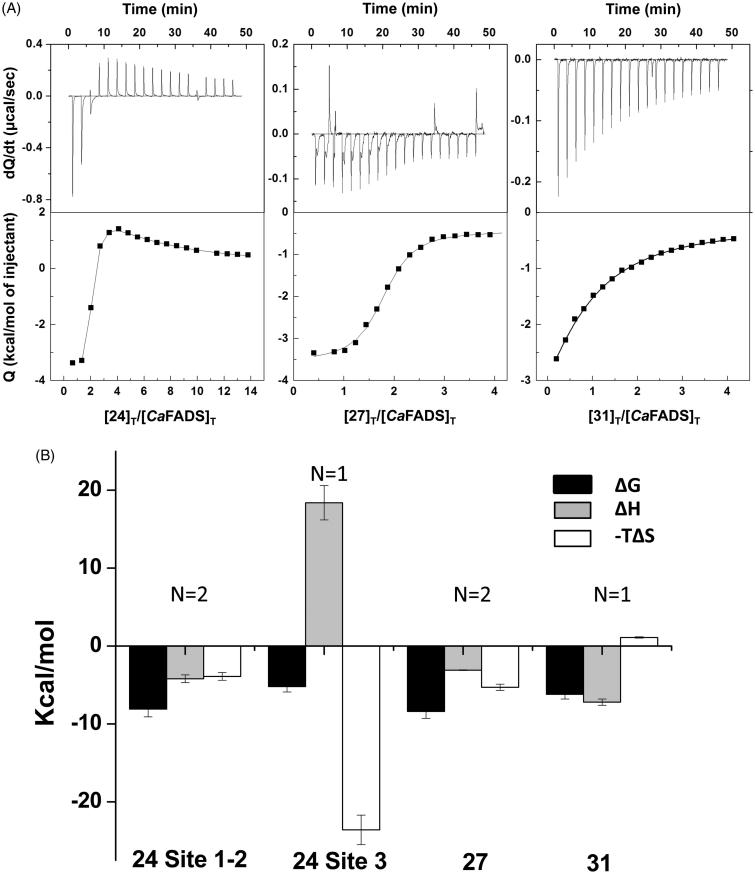
Figure 5.
Thermodynamic analysis of the binding of the selected FMNAT hits to CaFADS. (A) Calorimetric titrations for the 24, 27 and 31 compounds. The upper panels show the thermograms for the interaction and the lower panels show the corresponding binding isotherms with integrated heats. (B) Thermodynamic dissections of the interaction of CaFADS with each of the selected compounds. The binding Gibbs energy (ΔG), enthalpy (ΔH) and entropy (−TΔS) are represented in black, grey and white bars, respectively. Experiments were carried out at 25 °C, in 20 mM PIPES, pH 7.0, 10 mM MgCl2 and 3% DMSO.

