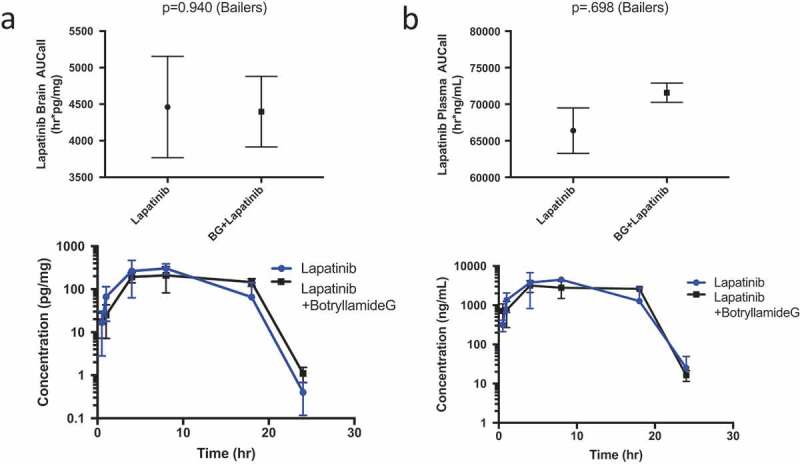
Figure 2.

Lapatinib AUC in the brain of wild-type mice (n = 3 at each timepoint) when treated with lapatinib alone or in combination with botryllamide G (a) and exposure curve over 24 h. Lapatinib AUC in the plasma of wild-type mice (n = 3 at each timepoint) when treated with lapatinib alone or in combination with botryllamide G (b) and exposure curve over 24 h. Error bars represent mean standard deviation.
