
Figure 6.
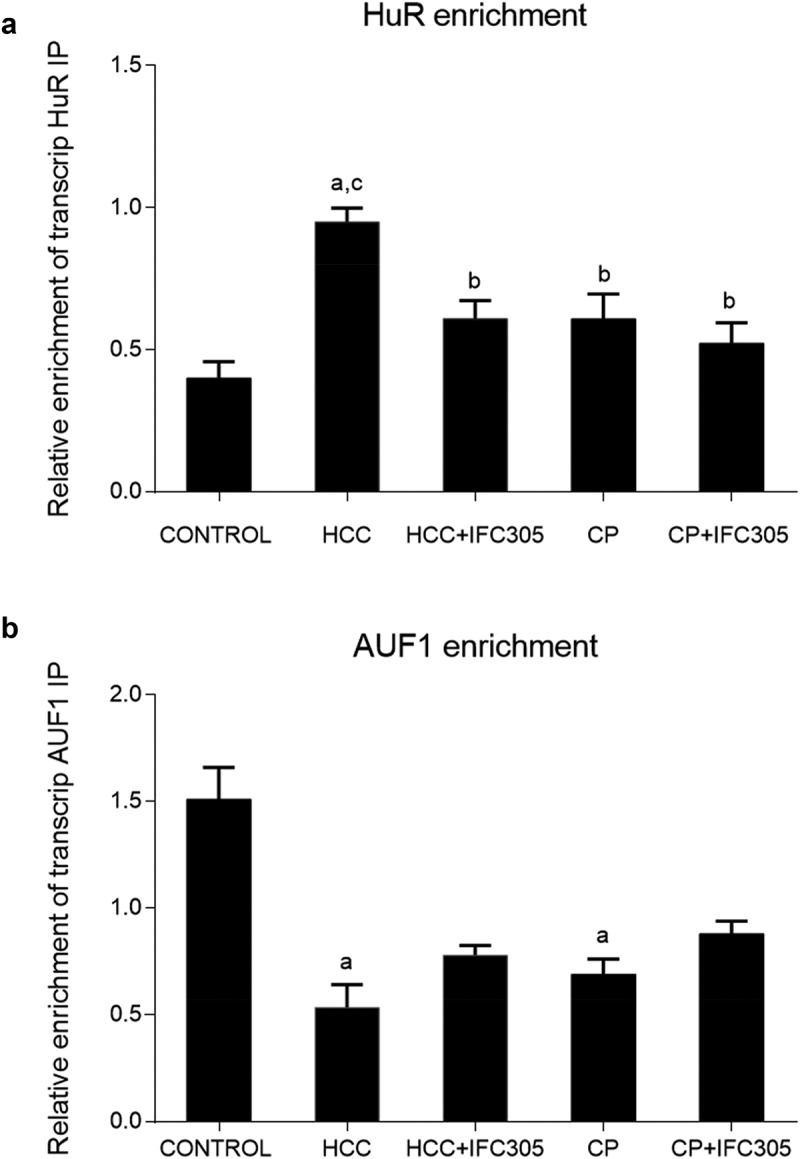
A) Enrichment of IP AUF-1 transcript; B) Enrichment of IP HuR-1 transcript.
Values are expressed as the mean ± SE (n = 5 rats/group). a indicates a significant difference vs. the control group; b indicates a significant difference vs. the HCC group; P < .05.