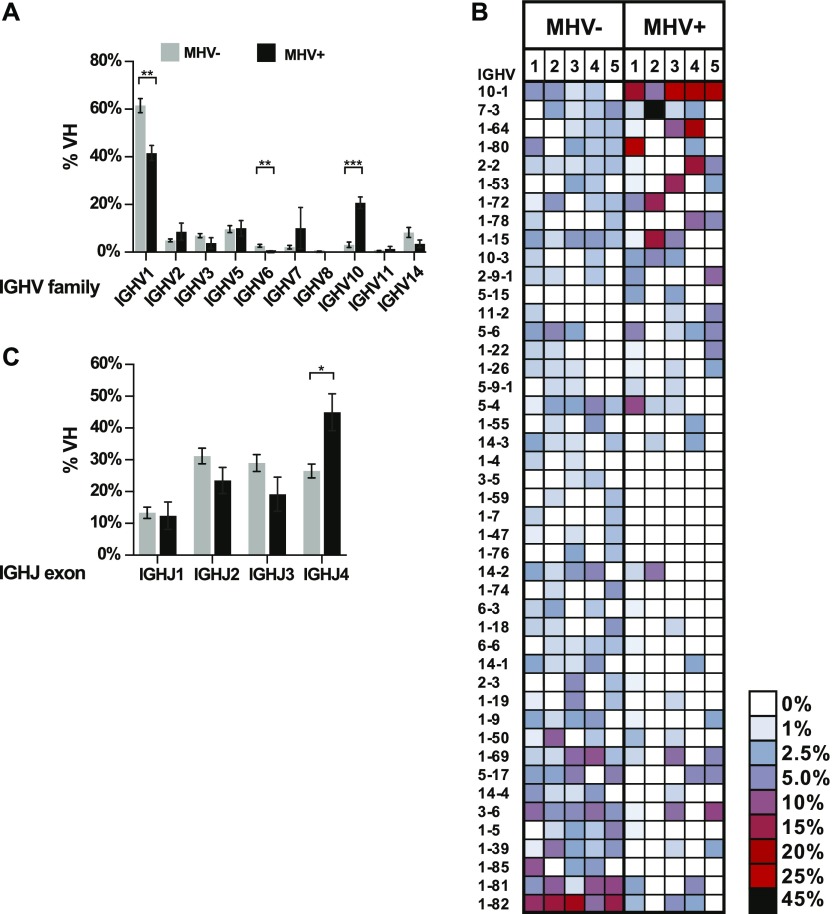
Figure 3. Differential usage of Ighv and Ighj exons in MHV68+ and MHV68− germinal center cells.
(A) Percentage of MHV+ and MHV− germinal center B cells that express an Ighv gene belonging to the indicated family. The mean of five independent biological sample is displayed. (B) Heat map of relative Ighv gene usage of MHV+ and MHV− populations from each of biological samples. Only Ighv segments present in more than one sample are displayed. Rows are ordered from the greatest positive (top) to negative (bottom) mean differential between the MHV+ and MHV− populations. (C) Summary of relative Ighj exon usage. Graphs show mean values from the five biological replicate samples with SEM. t test, *P ≤ 0.05, **P ≤ 0.01, ***P ≤ 0.001.

