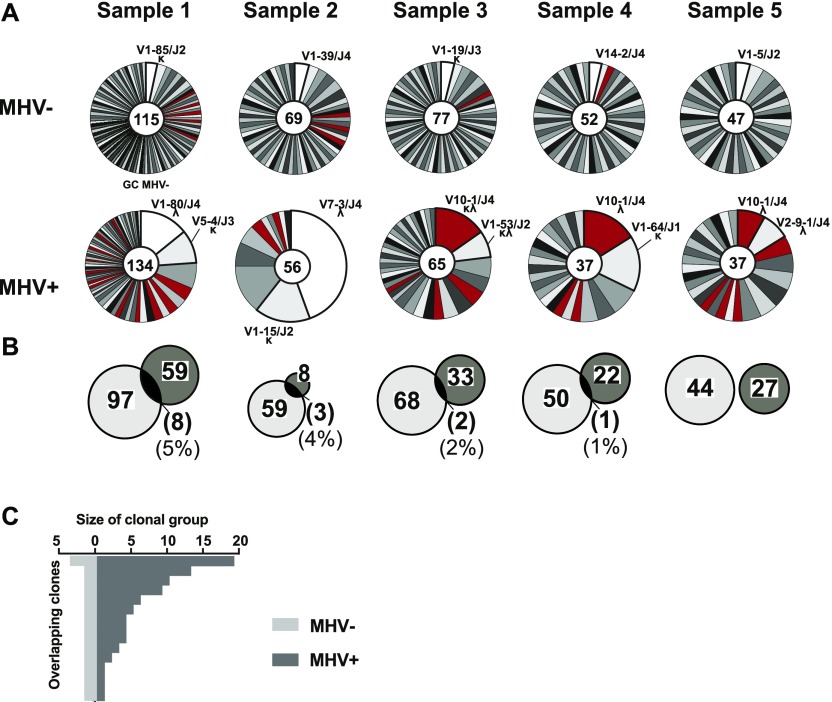
Figure 4. Clonal expansion of distinct repertoire in MHV68+ germinal center cells.
(A) Pie charts show proportion of individual cells belonging to distinct clonal groups within each population from five samples. Size of slice is proportional to number of sequences in each clonal group defined as sharing common Ighv, Ighj, and V(D)J junction. Number of total cells included in the pie chart is indicated in the center of each chart and the top clonal group(s) is(are) listed by Ighv, Ighj, and light chain type (κ or λ). Clonal groups that use Ighv10-1 are colored (Red). (B) Clonal groups with cells in both populations. Venn diagram circles are proportional to the number of clonal groups (listed inside circle) within MHV+ and MHV− populations of each sample. Brackets indicate the number of and relative percentage of clonal groups that were found in both populations. (C) Graph shows the number of cells that belong to the 14 clonal groups that were present in both the MHV+ and MHV− germinal center populations.

