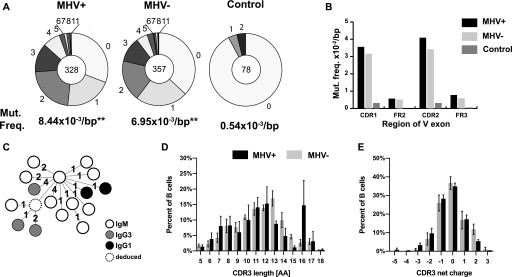
Figure 5. Comparison of hypermutation and CDR3 characteristics between MHV68+ and MHV68− germinal center (GC) cells.
(A) Pie charts show number of mutations in the expressed Ighv exon (from CDR1 to FR3) from MHV+ and MHV− GC cells as well as non-GC IgM+ control group from all samples. Pie chart wedges are proportional to the number of sequences with the indicated number of mutations. Total number of sequences analyzed from five samples is displayed in the center and average mutation frequency is indicated as mutations per base pair (bp) **P ≤ 0.01. (B) Mutation frequencies per bp calculated separately for indicated CDR and framework (FR) regions of the Ighv exon. (C) Representative MHV+ clone Ig phylogenic tree. Circle indicate a node (clonally related sequence) with isotype shown by the color. Dashed circle represents hypothetical split node intermediate. Each number denotes the number of mutations between nodes. (D, E) Analysis of relative length and (E) net charge distribution of the CDR3 region from the MHV+ and MHV− populations. The CDR3 characteristics from individual cells of all five samples is displayed as mean and SEM.

