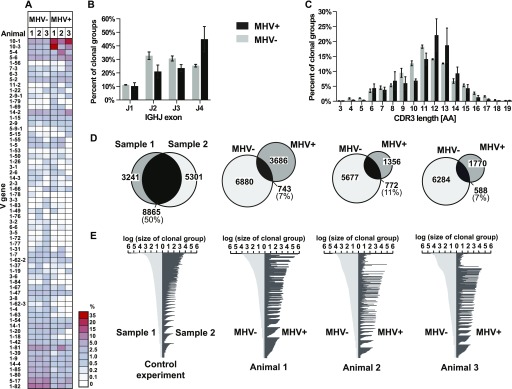
Figure 6. High-throughput sequencing repertoire and clonal analysis.
(A) Heat map showing the percentage of clonal groups using specific Ighv segments. Each sample consists of 20,000 MHV+ or MHV− germinal cells from individual mouse spleens 16 d after IP MHV68 inoculation. Rows are arranged from the greatest positive to negative mean differential between MHV+ and MHV− populations. Ighv segments are displayed that were present in more than one sample with a frequency above 0.1%. (B) Percentage of clonal groups using specific Ighj segments. (C) Percentage of clonal groups with designated Igh CDR3 length. Graphs show mean and SEM from three samples. (D) Clonal groups with the presence in both populations. Venn diagram circles are proportional to the number of clonal groups (listed inside circle) within MHV+ and MHV− populations of each sample. Control samples are replicate germinal center samples from a control mouse spleen. (E) Graphs display clonal groups with sequences MHV+ and MHV− populations. Number of reads from the MHV+ and MHV− populations are displayed for each clonal group.

