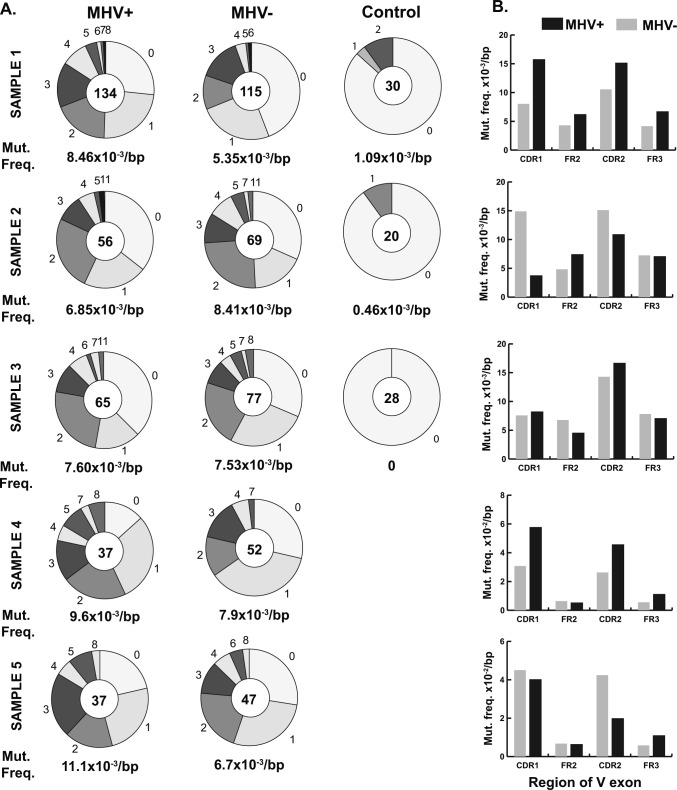
Figure S3. Comparison of mutation frequency and location between MHV68+ and MHV68− germinal center (GC) cell and non-GC cells.
Sequences of Ighv exons obtained from Sanger sequencing of B cells sorted individually onto 96-well plate. Figure shows five independent experiments: Samples 1–5. (A) Pie charts show number of mutations in Ighv exon (from CDR1 to FR3) identified by IMGT/HIghv-QUEST. Sizes of wedges are proportional to the number of Ighv segments with the number of mutations indicated outside the wedge. Total number of sequences analyzed is shown in the middle of pie chart. (B) Mutation frequencies per bp in MHV+ and MHV− GC cells calculated separately for the indicated regions of Ighv segments.

