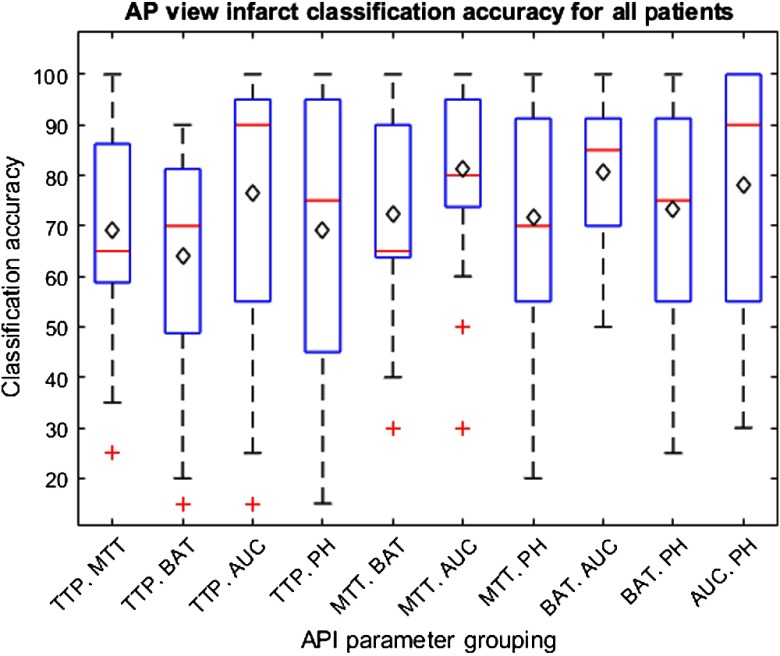
Fig. 12.
Box and whisker plot indicating the distribution of infarct core classification accuracies for individual patients utilizing all 10 API parameter groupings from the AP view. Average infarct classification accuracy for individual patients is indicated by the black diamond. Outliers are indicated by red crosses. Note that narrow interquartile ranges indicate parameter groupings are successful to similar degrees across all patients.

