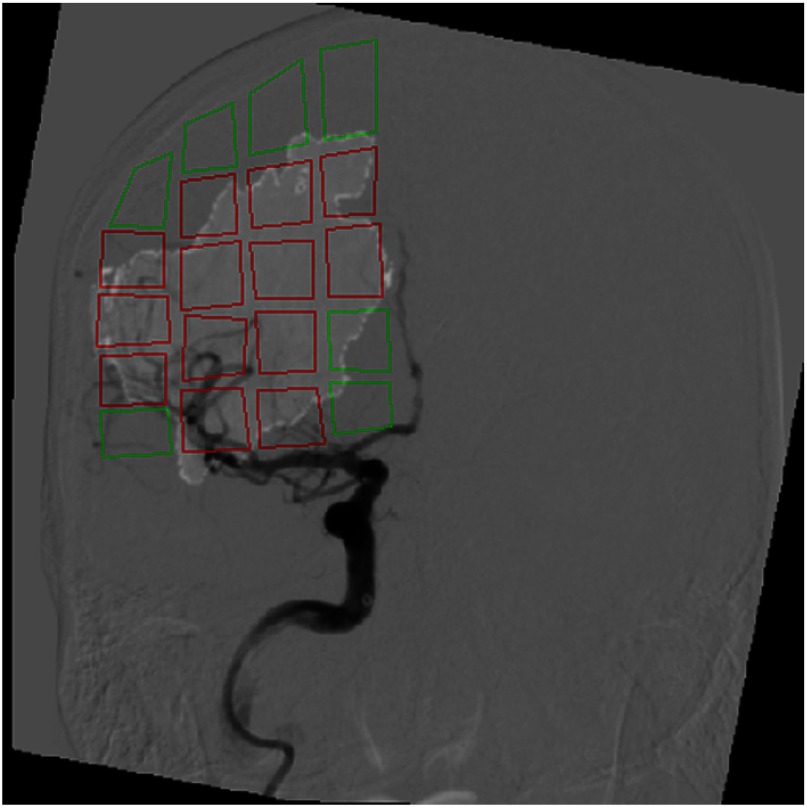
Fig. 13.
Overlay of infarct core onto an AP view DSA image following ROI classification as infarct or healthy tissue. This classification utilized the API parameters AUC and MTT to label infarct and healthy tissue. The red and green ROIs represent regions labeled as infarct and healthy tissue, respectively. Note the regions with very minute amounts of infarct () were labeled as healthy tissue.

