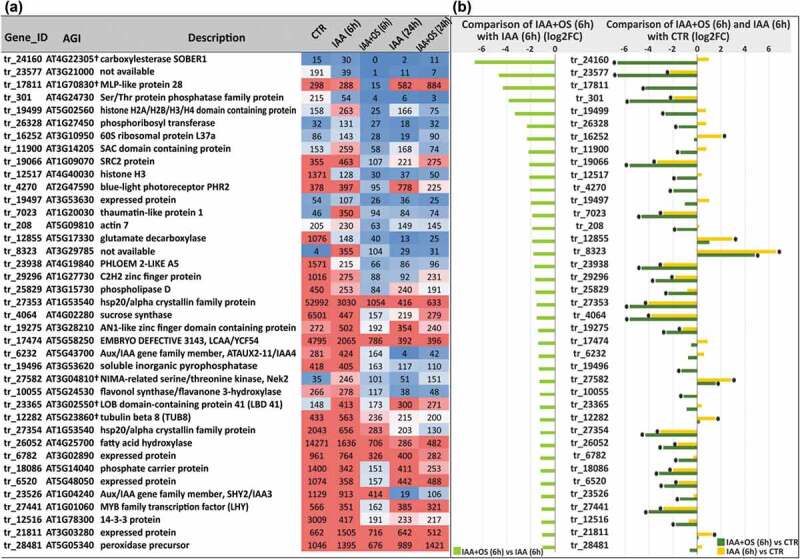
Figure 4.

(a) List of downregulated genes in IAA+OS (6 h) samples compared with IAA (6 h) samples (cut off log2FC<1, padj<0.05) and the corresponding expression level indicators in the form of normalized TGR values. (b) Expression levels of downregulated genes (log2FC <1, padj<0.05) in IAA+OS (6 h) samples compared to IAA (6 h) samples (left) and in the comparison of IAA+OS (6 h) samples with the control sample (CTR; 0 h) (right): “*” denotes differentially expressed genes with a padj value <0.05.
