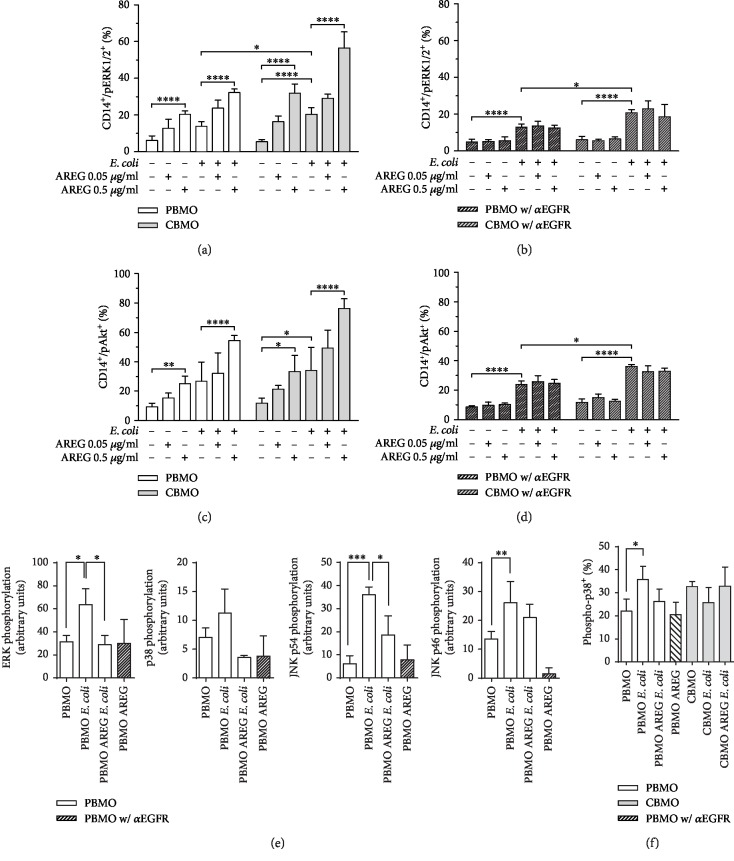
Figure 1.
MAPK and Akt phosphorylation—levels of activated monocytes and intracellular protein levels in PBMO and CMBO in response to infection, AREG stimulation, and inhibition of EGFR. Isolated monocytes were infected with E. coli, extracellular bacteria were removed, and the cells were cultivated for 24 h in medium supplemented with antibiotics. 1 h prior to infection, AREG stimulation and EGFR inhibitor treatment were started and maintained during the entire cultivation period. Quantification was performed by flow cytometry (a–d, f). (a) Detection of pERK1/2 in PBMO and CBMO in response to infection and AREG stimulation. AREG stimulation dose-dependently induces phosphorylation in all settings. ERK1/2 phosphorylation is induced in response to E. coli infection (n = 5). (b) Effect of EGFR inhibition on pERK1/2 in PBMO and CBMO in response to infection and AREG stimulation. Inhibition of EGFR abolishes the AREG-dependent phosphorylation (n = 4). (c) Detection of pAkt in PBMO and CBMO in response to infection and AREG stimulation. AREG stimulation dose-dependently increases pAkt levels in all settings. Akt phosphorylation is induced in response to E. coli infection (n = 5). (d) Effect of EGFR inhibition on pAkt in PBMO and CBMO in response to infection and AREG stimulation. Inhibition of EGFR abolishes the AREG-dependent phosphorylation (n = 4). Quantification of immunoblot signals on which the indicated MAPK were detected ((e); n = 3). Detection of pp38 in PBMO and CBMO in response to infection and AREG stimulation ((f); n = 4). Data are shown as means + SD. Statistical significance was analyzed using two-way ANOVA with Bonferroni's multiple comparisons test (∗p < 0.05; ∗∗p < 0.01; and ∗∗∗∗p < 0.001). In (e, f), error bars detail results of unpaired Student's t-test with Welch correction (∗p < 0.05; ∗∗∗p < 0.005).

