Figure 1.
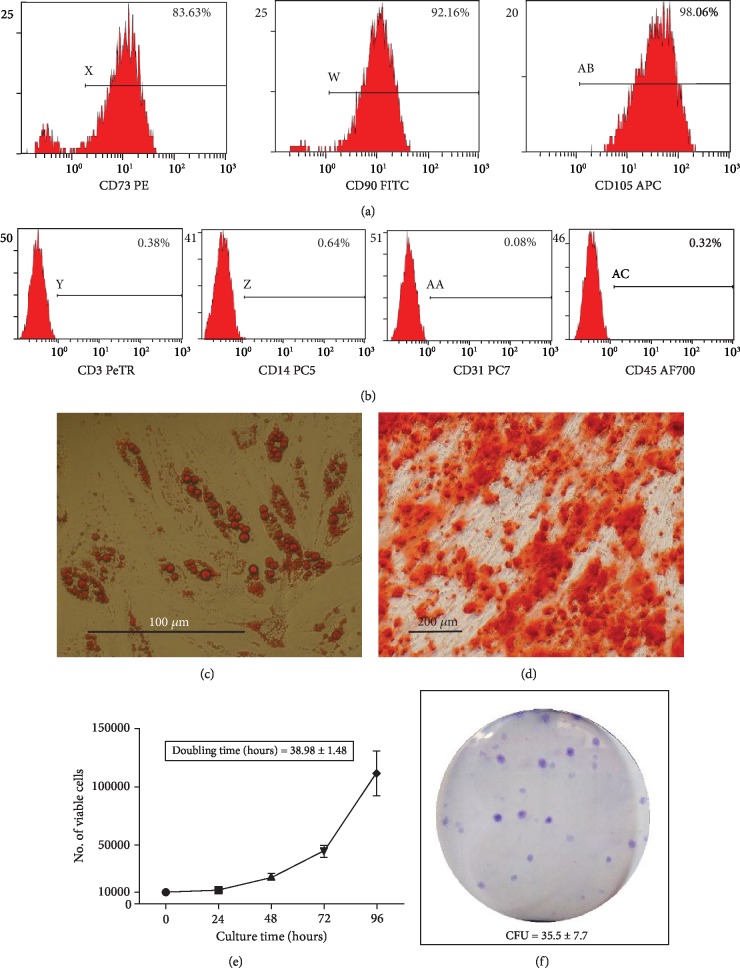
ASC characterization based on immunophenotype, differentiation, doubling time, and CFU-F assay. (a-b) Histograms display detection of surface antigen markers; (a) Positive markers CD73, CD90, and CD105; (b) Negative markers CD3, CD14, CD31, and CD45. (c) Representative image of Oil Red O stained cells; intracellular oil droplets (red) are visible in ASCs cultured in adipogenic media for 28 days (scale bar 100 μm). (d) Representative image of Alizarin red stained cells; mineral deposition (red) is visible around ASCs cultured in osteogenic media for 28 days (scale bar 200 μm). (e) Proliferation curve of ASCs from 0-96 hours, mean doubling time; 38.98 ± 1.48 hours. (f) Representative image of crystal violet stained ASC colonies; 35.5 ± 7.7 CFUs were observed per 100 cells seeded on cell culture plate and cultured in stromal media for 14 days. All displayed data are derived from 3-donor-pooled; Passage 2 ASCs.

