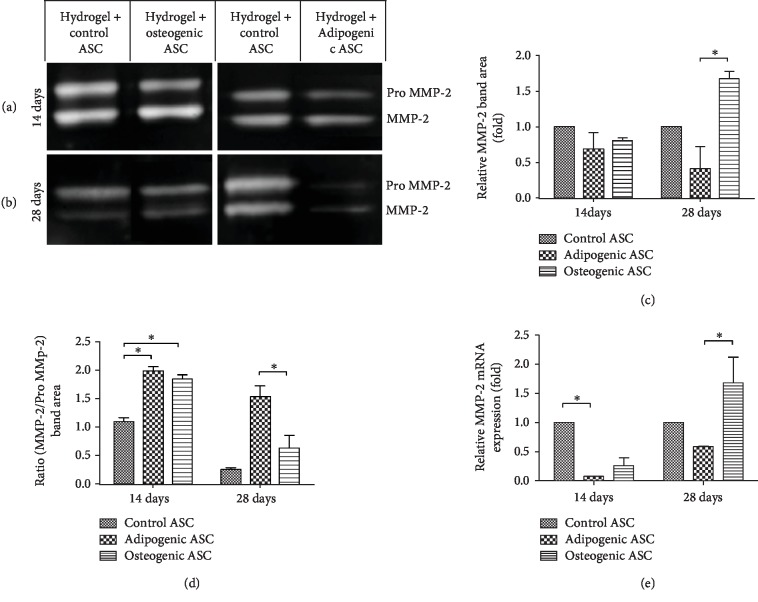
Figure 6.
Analysis of MMP-2 expression by gelatin zymography and qRT-PCR. (a, b) Representative images of Pro MMP-2 and MMP-2 bands observed after gel electrophoresis of 14 (a) and 28 (b) day samples. (c) Pro MMP-2 and MMP-2 band area was determined by densitomteric analysis using ImageJ software, data are presented as fold change relative to the control samples. (d) Ratio of MMP-2 band area to Pro MMP-2 band area determined by densitometric analysis. (e) qRT-PCR analysis of MMP2 mRNA expression in control, adipogenic, and osteogenic samples are displayed as fold change relative to the control samples. Data are expressed as mean (n = 6) ± SD; level of significance: (∗) p < 0.05.

