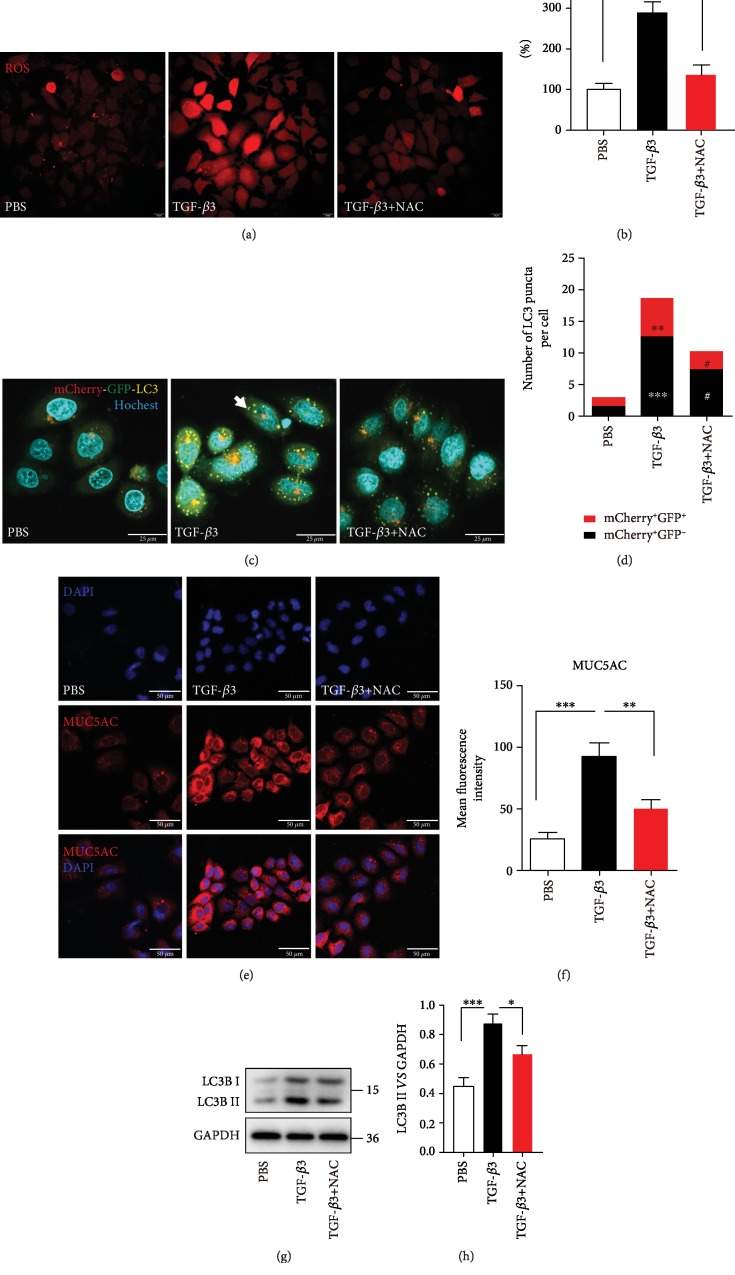
Figure 3.
TGF-β3-induced ROS production triggers autophagy and upregulates MUC5AC in the airway epithelial cells. (a, b) 16HBE cells were incubated with NAC for 2 hrs and then treated with TGF-β3 for another 24 hrs. And then, the ROS generation was measured using the oxidant-sensitive fluorometric probe BBoxiProbeTM A. Representative images of BBoxiProbeTM A probe fluorescent signal and the fold change of ROS signal intensity are shown. (c) 16HBE cells that stably expressed mCherry-EGFP-LC3 fusion protein were incubated with NAC for 2 hrs and then treated with TGF-β3 for another 24 hrs. In green- and red-merged images, autophagosomes are shown as yellow puncta (i.e., mCherry+EGFP+), while autolysosomes are shown as red puncta (i.e., mCherry+EGFP−). Autophagic flux was increased when both yellow and red puncta are increased in the cells. Confocal microscopic analysis was shown (×1000 magnification). (d) Quantification of the number of LC3 puncta (each group n = 10 images for quantification). (e) 16HBE cells were incubated with NAC for 2 hrs and then treated with TGF-β3 for another 24 hrs. Representative immunofluorescence images of TGF-β3-induced MUC5AC in 16HBE cells treated with NAC. (f) Quantitation of the fluorescence intensity of MUC5AC. (g, h) LC3B was detected by western blot. And relative changes in the density of LC3B II were detected. Data are representative of three independent experiments and are presented as means ± s.d.∗P < 0.05, ∗∗P < 0.01, and ∗∗∗P < 0.001, TGF-β3 vs. PBS; #P < 0.05 and ##P < 0.01, TGF-β3+NAC vs. TGF-β3, determined by one-way ANOVA with Tukey-Kramer posttest.

