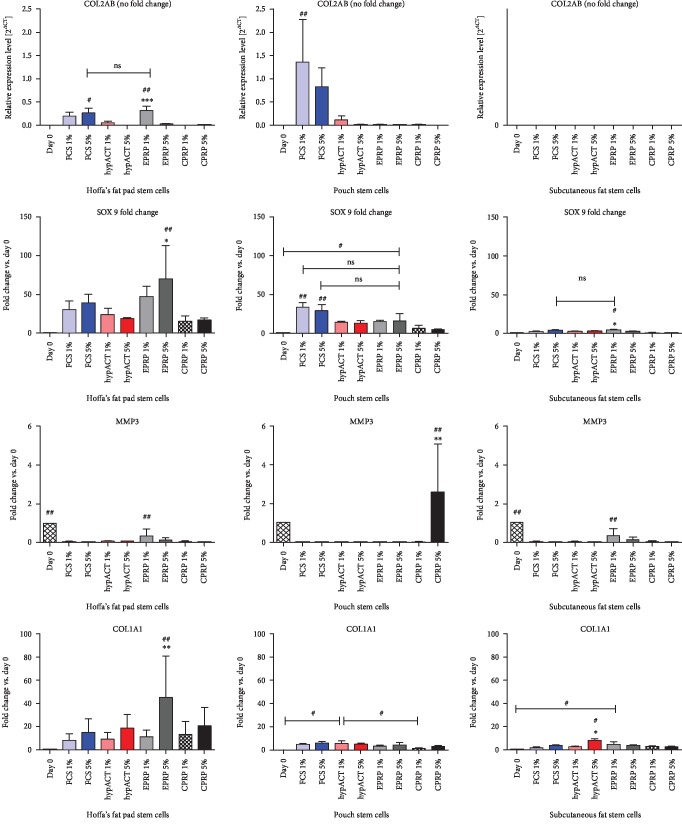
Figure 7.
Gene expressions for chondrogenic differentiation experiments. COL1A1=collagen 1A1 gene; COL2AB=collagen 2 gene; CPRP=citrate platelet-rich plasma (black); EPRP=EDTA platelete-rich plasma (gray); FCS=fetal calve serum (blue); hypACT=hyperacute serum (red); MMP3=matrix metalloproteinase-3 gene. Results are expressed as the mean ± SD. # indicates a significant difference in gene expression between different treatment groups. # represents p < 0.05, ## represents p < 0.01, and ### represents p < 0.001. ∗ indicates a significant difference in gene expression within one treatment group. ∗∗ represents p < 0.01 and ∗∗∗ represents p < 0.001.

