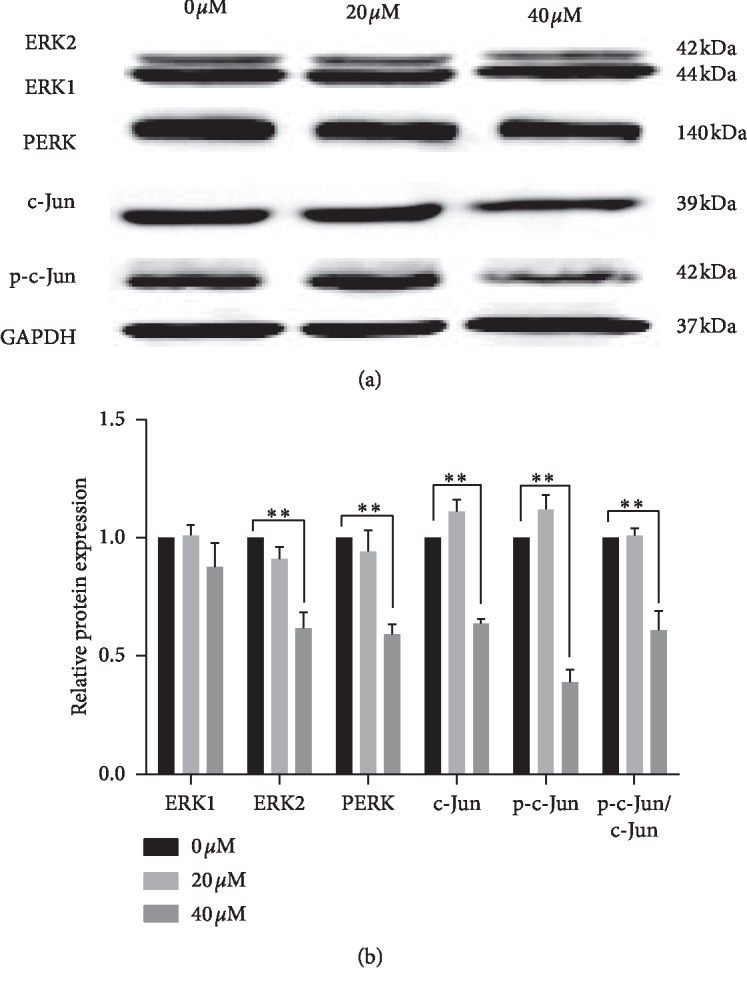
Figure 8.

(a) Western blot was used to detect protein expression levels of ERK1/2, c-Jun, PERK, and p-c-Jun. At 40 μM, the protein expression of PERK and p-c-Jun was reduced after curcumin treatment. (b) Gray value of each band was obtained from grayscale analysis. Relative protein expressions were calculated with 0 μΜ group. Each experiment was repeated three times independently, and the statistical results were expressed as mean ± standard deviation, compared with expression of GAPDH. ∗p < 0.05 and ∗∗p < 0.01.
