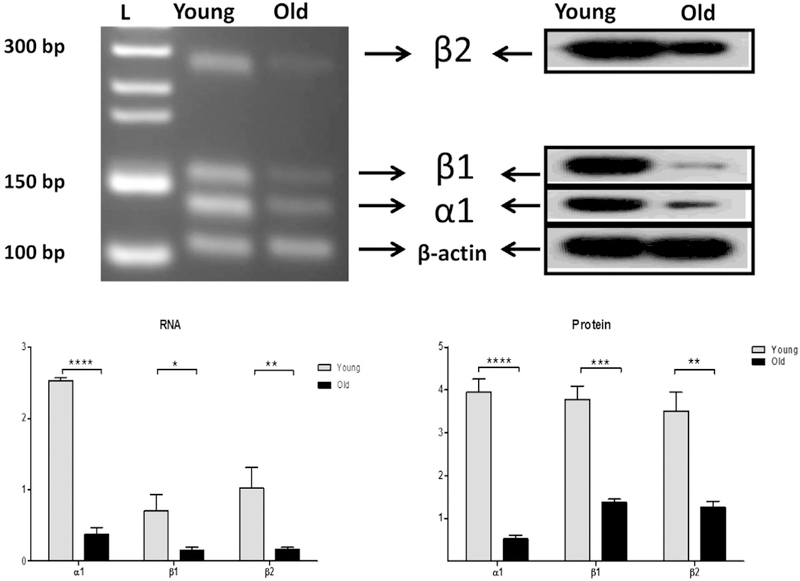
Fig. 2.
Age-related decreases in Na, K-ATPase subunit gene and protein expressions from cochlear lateral walls from young adult (3 mon) and old (30 mon) mice. The protein lysates and mRNA extractions were subjected to RT-PCR analysis and western blot analysis respectively. a. Original RT-PCR result was shown in an agarose gel image. For the α1 subunit, the expected product of 141 bp was observed; b1 subunit, 166 bp; and β2 subunit, 276 βp. Lane L is 50 bp DNA ladder. b. Quantitative real-time RT-PCR is summarized in a bar graph. The differentiation of expressions are shown as arbitrary units. c. Left panel: NKA subunit protein expressions were shown in western blot. Lane L is the protein molecular weight marker. Right panel: The relative expression levels are summarized by the histograms from 3 independent experiments, using densitometry quantification (NIH, Image J). *p < 0.05; **P < 0.01; ***P < 0.005; ****P < 0.001. Bar graph results are means ±SD from 3 independent experiments.

