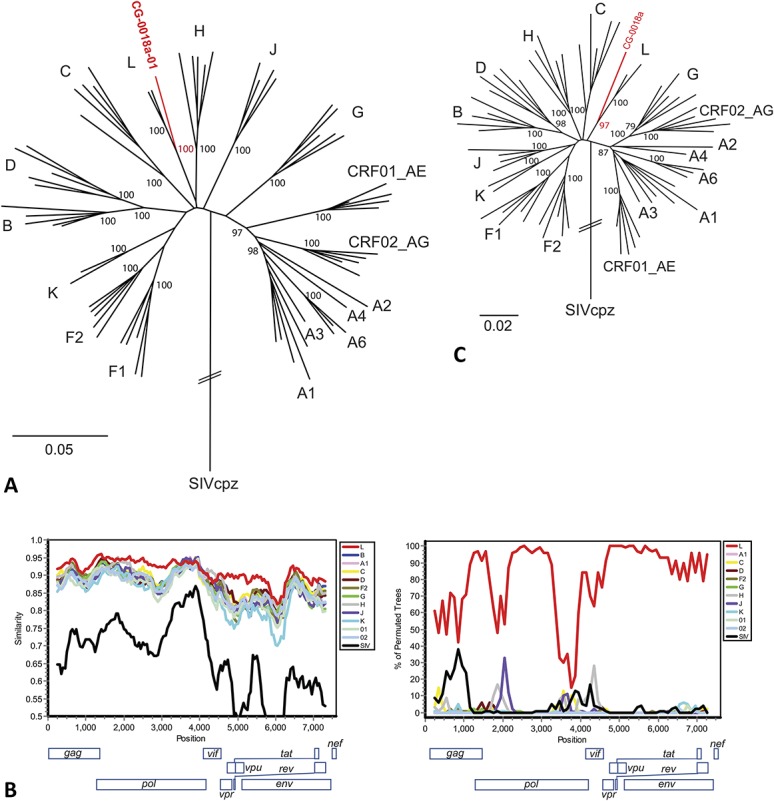
FIGURE 2.

Sequence analysis of the CG-0018a-01 complete genome. A, HIV-1 group M maximum likelihood phylogenetic tree (7578 bp) shows the sequence of CG-0018a-01 groups with the 2 putative subtype L sequences with a bootstrap of 100. B, SimPlot (Window: 500 bp, Step: 50 bp) and Bootscan (Window: 500 bp, Step 100 bp) show % identity is highest to the putative subtype L reference sequences except in the well-conserved pol region (approximate positions 3500–4600). C, Results of neighbor-joining phylogenetic analysis of positions 3500–4600 show that the sequence of CG-0018a-01 continues to group with the putative subtype L sequences with a bootstrap of 97.
