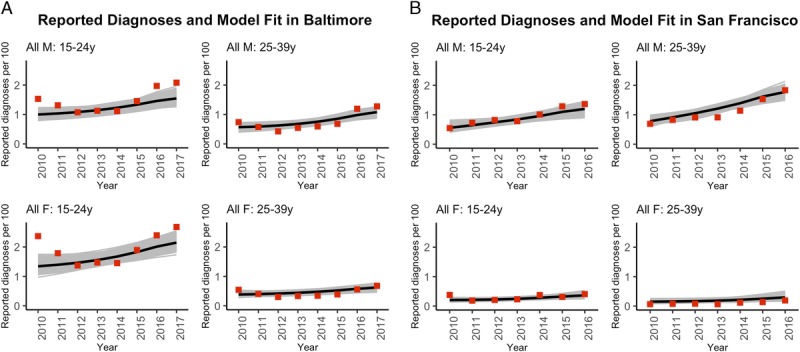
Figure 1.

Model fit to overall gonorrhea diagnosis rate for (A) Baltimore City and (B) San Francisco. With men (M) on top row and women (F) on bottom row. Diagnosis rate data are presented as red squares, and model posterior simulations as mean (black line) and 100% range (gray lines). Note the different x-axes between plots. Further calibration results for both cities are in the Supplementary materials 2 and 3.
