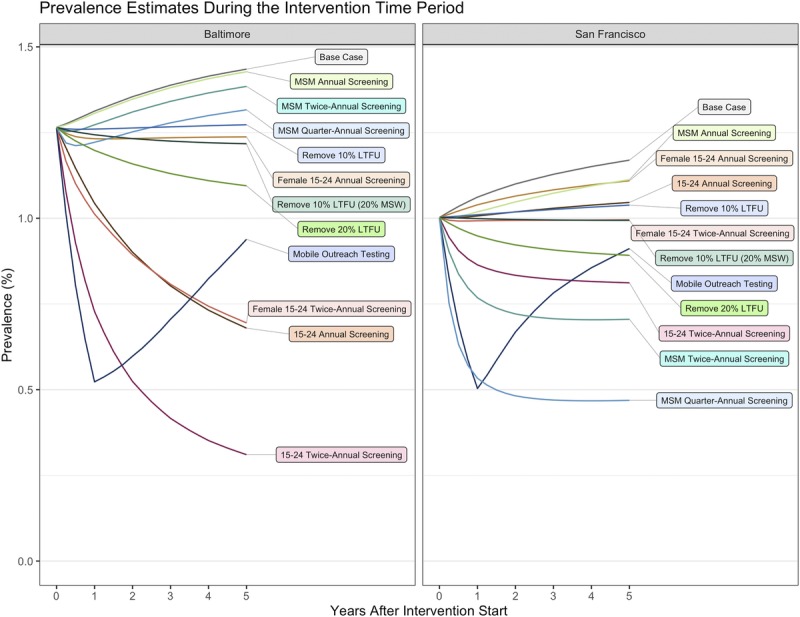
Figure 2.

Population prevalence estimates per 100 persons during the intervention period, presented as the mean of the calibrated model (base case) and for the counterfactual interventions. Footnote: Mobile Outreach Testing (50% HR/high-activity, 10% LR/low-activity population scenario presented; see supplement 1, Fig. S4 for the sensitivity analysis results). Remove 10% LTFU: assume 10% LTFU for all asymptomatic, which is removed in the counterfactual; remove 20% LTFU: assume 20% LTFU for all asymptomatic, which is removed in the counterfactual; remove 10% LTFU (20% MSW): assume 10% LTFU for all MSM and women, and 20% for MSW.
