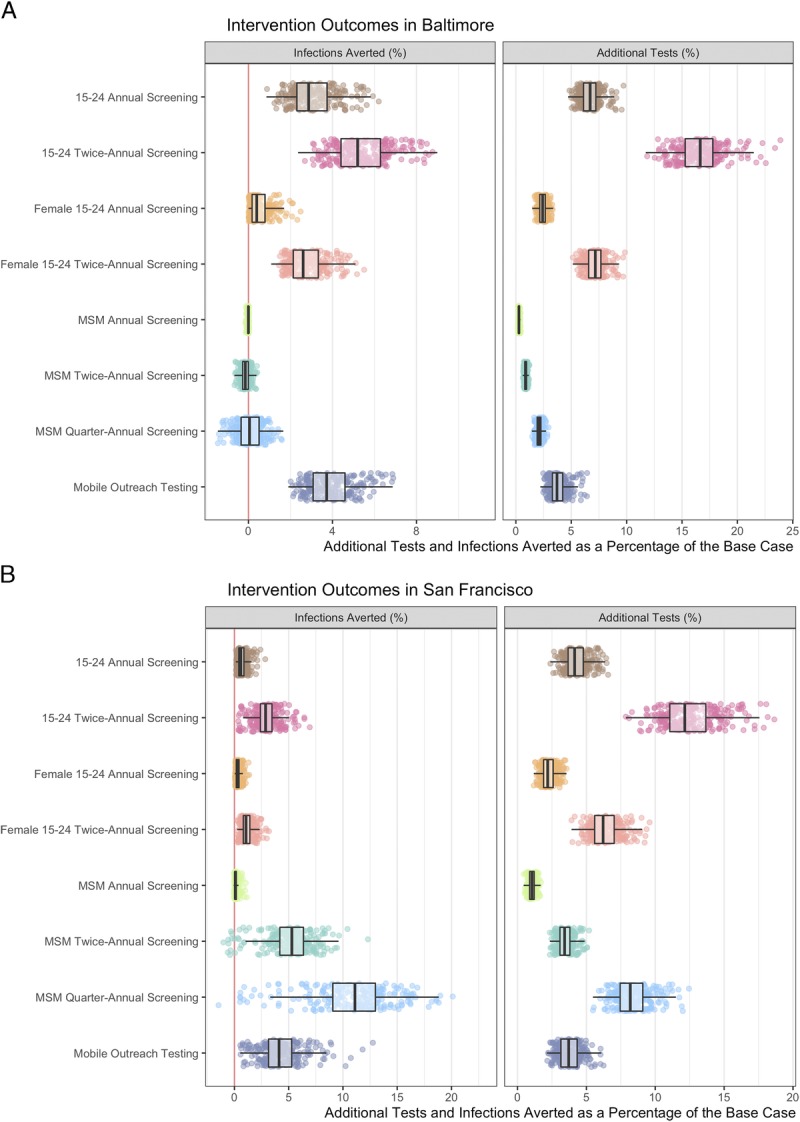
Figure 3.

Cumulative infections averted and additional tests relative to the calibrated model (%) for the population in (A) Baltimore City and (B) San Francisco for the 5-year time period. The red vertical line at 0 defines a point at which the same number of incident infections occurred in base case than in the intervention. When less than 0, the 5-year incidence is higher in the intervention scenario than in the base case. Footnote: Mobile Outreach Testing (50% high-activity, 10% low-activity population scenario presented; see supplement 1, Fig. S4 for the sensitivity analysis results). Scatter plots present a sample of 250 model simulations to display the underlying distribution. Boxplots represent summary statistics for all 1000 simulations.
