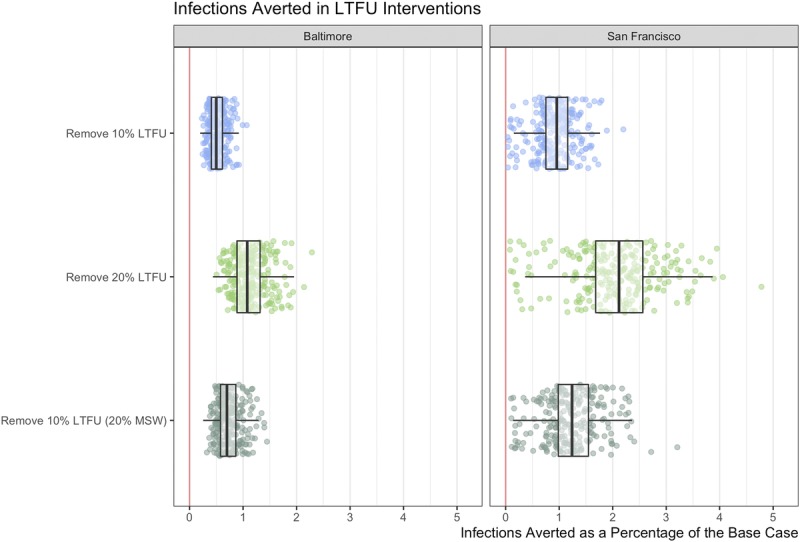
Figure 4.

Cumulative infections averted and additional tests relative to the calibrated model (%) for population in Baltimore and in San Francisco for the 5-year period. For the LTFU scenarios, infections are averted through better follow-up of diagnosed patients, by adjusting the treatment rate of the base case model. Footnote: Remove 10% LTFU: assume 10% LTFU for all asymptomatic, which is removed in the counterfactual; Remove 20% LTFU: assume 20% LTFU for all asymptomatic, which is removed in the counterfactual; Remove 10% LTFU (20% MSW) assume 10% LTFU for all MSM and women, and 20% for MSW, which is removed in the counterfactual. Scatter plots present a sample of 250 model simulations to display the underlying distribution. Boxplots represent summary statistics for all 1000 simulations.
