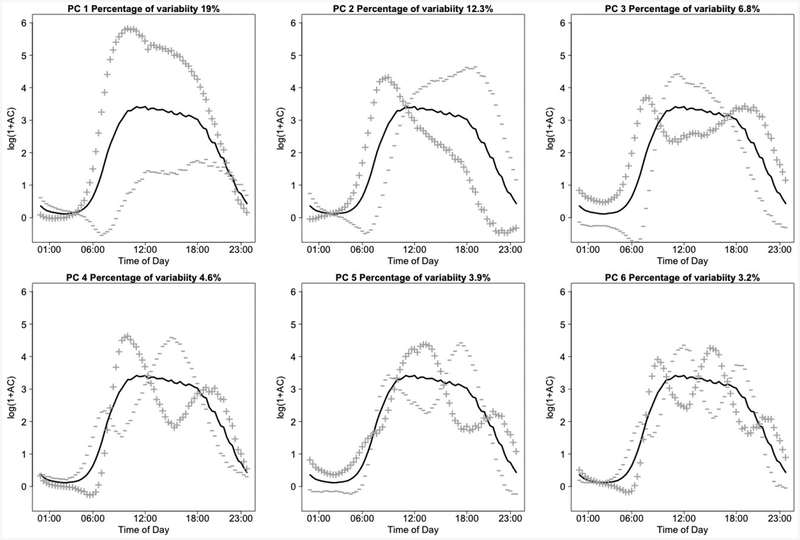
Fig. 4:
First 6 principal components calculated on the population, minute level NHANES accelerometry data using functional principal component analysis. Solid lines represent the population average curve, +, — lines denote the effect of being 2 standard deviations from a score of 0 on the particular principal component.

