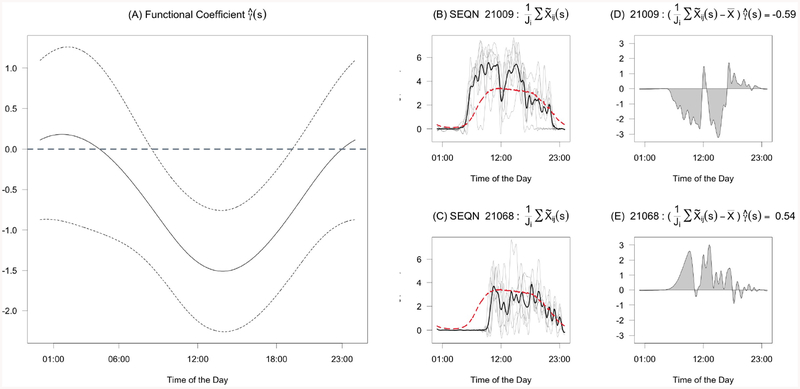
Fig. 5:
(A) Estimated Functional Coefficient For Daily Activity Patterns γ(s) with 95% pointwise confidence intervals presented as thin dashed lines. (B)/(C) Smoothed activity counts for one day of data for two different NHANES participants. The grey lines denote individual daily smoothed profiles. The black line denotes the average profile, . The dashed red line is the population average profile . The difference between the solid black line and the red dashed line is the functional predictor in model 3. (D)/(E) Contribution to the log odds for these example days of accelerometry data.

