Fig. 1.

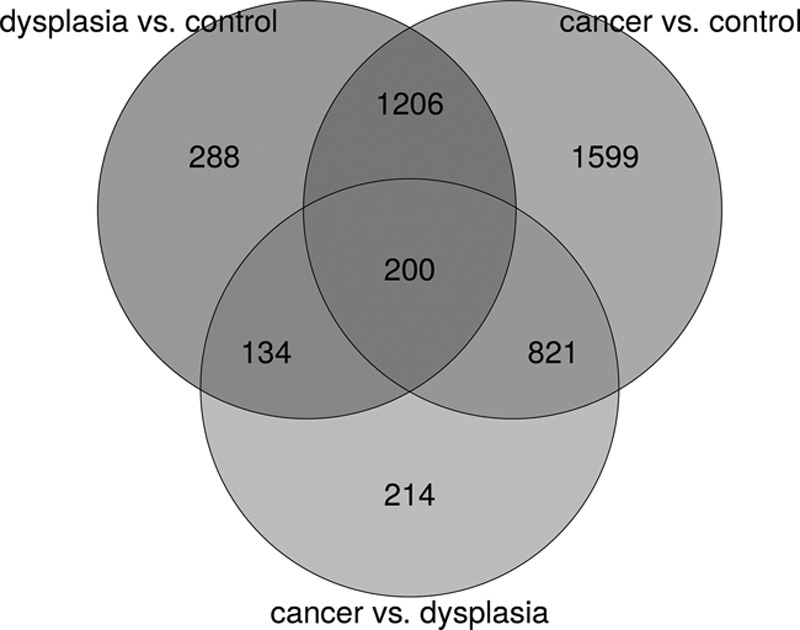
Venn picture of DEGs. The DEGs were filtered with foldchange >2 or <1/2, and the adjusted P value was <0.05. The number and overlap of DEGs between the three groups were compared. DEGs, differentially expressed genes.

Venn picture of DEGs. The DEGs were filtered with foldchange >2 or <1/2, and the adjusted P value was <0.05. The number and overlap of DEGs between the three groups were compared. DEGs, differentially expressed genes.