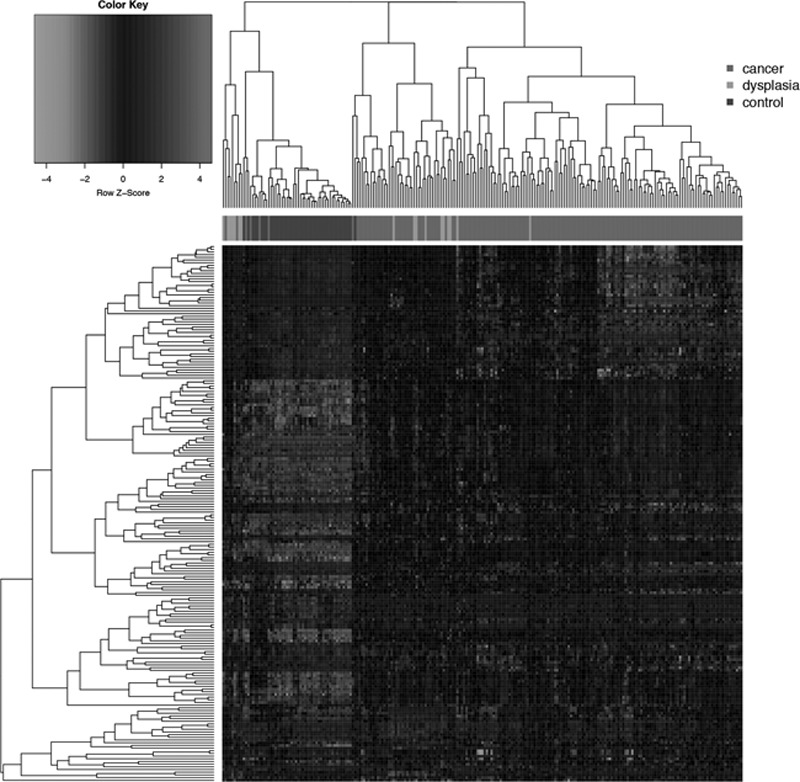
Fig. 4.

Heatmap of DEGs. Intersample distances are expressed using 1 – pearson correlation; distances between groups are calculated based on complete linkage, and clusters of samples and DEGs are hierarchically clustered. DEGs, differentially expressed genes.
