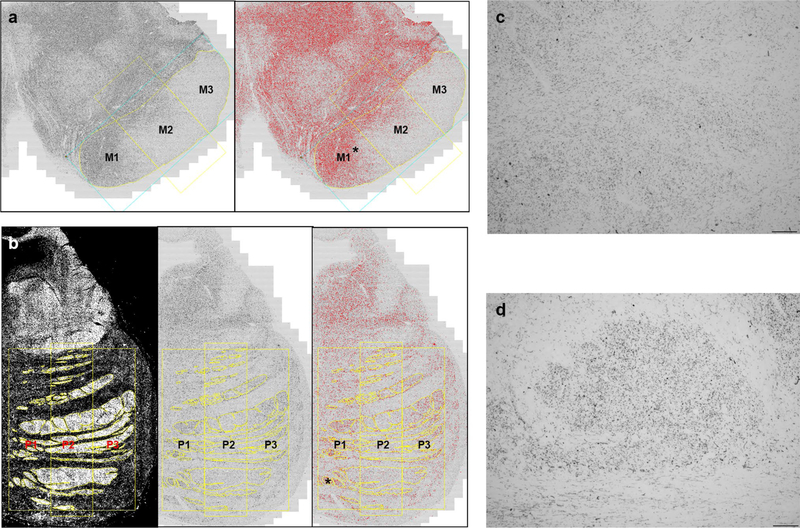
Fig. 2.
Region-of-interest delineation for the midbrain cerebral peduncle and pontine fibers. Midbrain cerebral peduncle (a) was divided into three portions (yellow line) based on a one-dimensional geometric baseline connecting the most medial (M1) and lateral points (M3) of the peduncle (blue rectangle). Basal pontine descending fibers were divided into three portions, P1, P2, and P3, from medial to lateral. The ROIs were drawn on the eight bit black and white image for midbrain (a, left) and the darkfield images for pons (b, left), which were transposed into black and white images (b, middle). After adjusting the Yen algorithm to a threshold (a, right; b, right), the tau area fraction (%) for each of ROI was obtained. High magnification views of asterisk in a, b show that the tau staining within the midbrain (c) and pontine (d) ROIs appears as predominantly small dotlike structures, suggesting axially cut descending axons. In general, the degree of staining within potentially non-axonal structures was correlated with the degree of axonal tau staining

