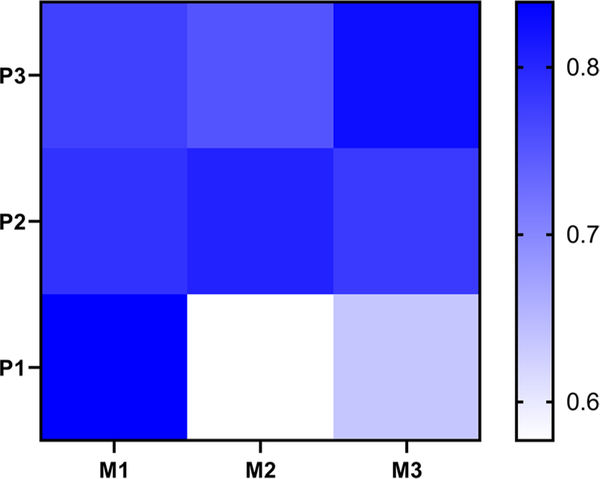
Fig. 5.
A heat map showing the correlations between the six ROIs of midbrain cerebral peduncle and basal pons. The strongest correlations between M1vs. P1, M2 vs. P2, and M3 vs. P3 suggest that tau from the same cortical sources spreads along the efferent axonal pathway. Even the lowest correlations are nonetheless high, as might be expected, since regions in all three sectors are typically affected to some degree in each patient

