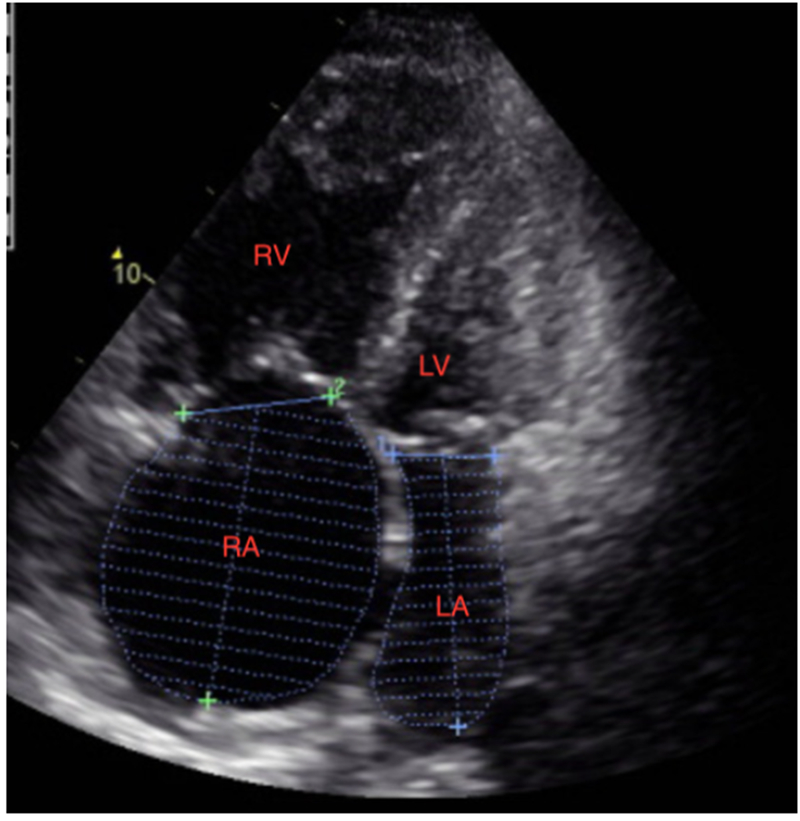
Figure2:

Bland-Altman Plot for Right Atrial Volume and Left Atrial Volume. Inter-observer variability was shown using a Bland-Altman Plot for both RAVI and LAVI. The intra-class correlation coefficient for RAVI was 0.92 (P < 0.0001) while the intra-class correlation for LAVI was 0.71 (P < 0.0001).
