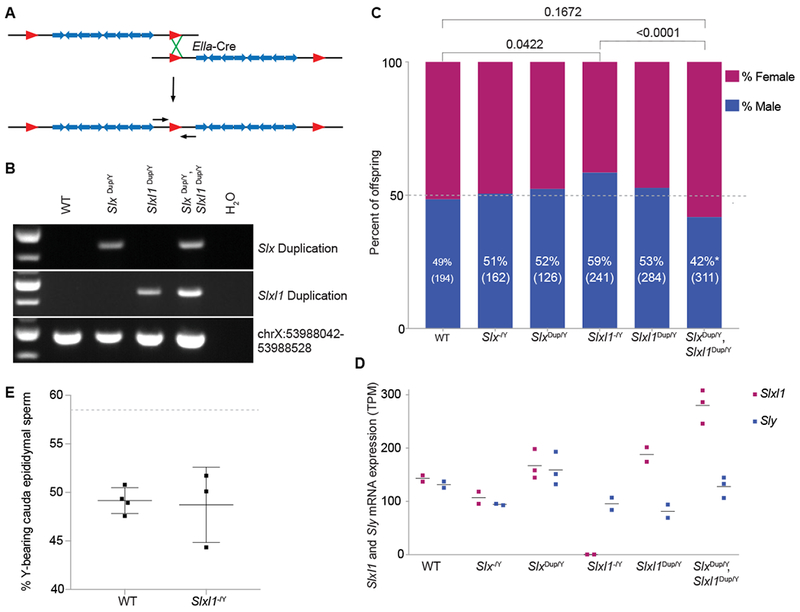
Figure 3. Changes in Slxl1 gene dosage results in sex ratio distortion of offspring and Slxl1 gene expression levels.

(A) Schematic representation of a floxed (red triangles) ampliconic region with segmental duplications (blue arrows). Duplications were generated by expression of Ella-Cre and pups were genotyped using PCR primers spanning the duplication junction (small black arrows). (B) Representative genotyping of wildtype (WT), Slx duplication (Slx dup/Y), Slxl1 duplication (Slxl1 dup/Y) and Slx/Slxl1 (Slx dup/Y, Slxl1 dup/Y) duplication mice. ChrX:53988042-53988528 is unique sequence, which controls for retaining the intervening sequence present between the Slx and Slxl1 ampliconic regions. (C) Males of each genotype were mated against wildtype females and progeny were sex genotyped. The percent of male offspring is shown as a percentage along with the number of pups screened in parentheses. P-values were calculated using a two-tailed Fisher’s Exact test, compared to experimental WT data (bars on top) and theoretical 50:50 data with an equivalent population size (p<0.05, asterisk near male percentage). (D) mRNA-seq was performed on isolated round spermatids. The horizontal line represents average expression across biological replicates (bullets) for Slxl1 and Sly. TPM, Transcripts per million. (E) X and Y chromosome paint was performed on sperm collected from the cauda epididymis of wildtype and Slxl1−/Y males. Each bullet represents the percentage of Y-bearing sperm from one male, with overall mean and standard deviation. Dotted line denotes expected percentage of Y-bearing sperm if ratio of X- to Y-bearing sperm reflected observed Slxl1−/Y sired offspring sex ratio. Differences between wildtype and Slxl1−/Y are not significant, Fisher’s exact test two-tailed. See also Data S1.
