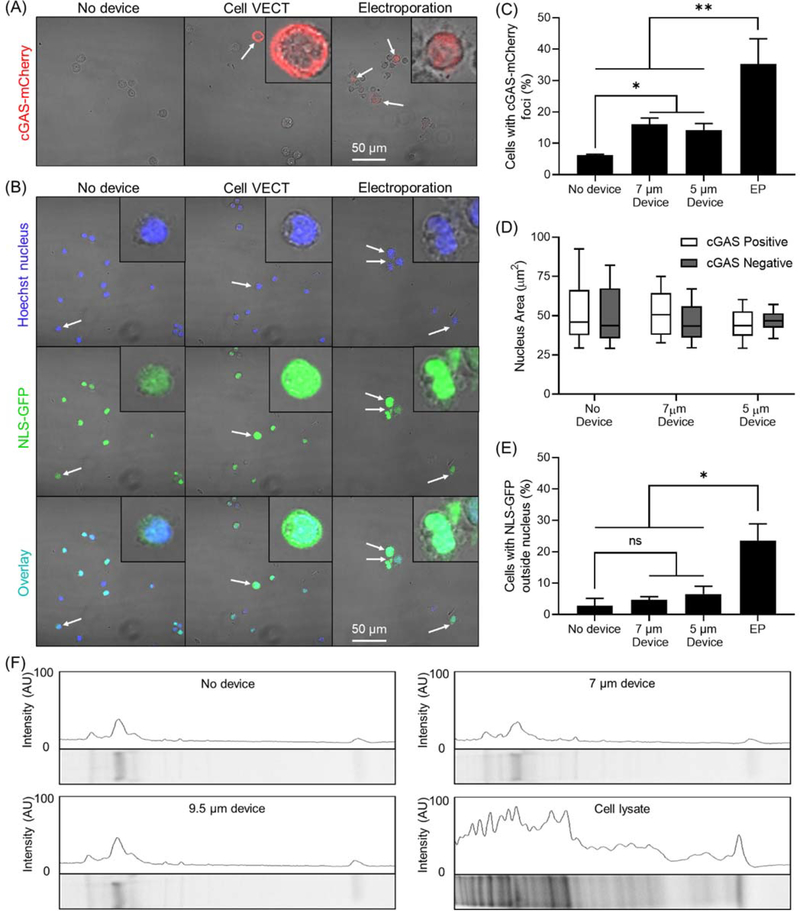
Figure 4.
Analysis of nuclear envelope disruption and protein loss. (A) Confocal microscopy shows cGAS-mCherry foci (white arrows) present in a minority of 7 μm gap device-processed cells and a significant portion of electroporated cells. Cells in insets are zoomed in 5X. (B) Confocal imaging shows colocalization of NLS-GFP to the Hoechst-stained nucleus in the majority of No device and 7 μm gap device cells, with NLS-GFP outside the nucleus in a small minority of cells (white arrows). NLS-GFP can be observed outside the nucleus in electroporated cells. Cells in insets are zoomed in 5X. (C) Cell VECT treated cells demonstrated ~10% increase in number of cells expressing cGAS-mCherry nuclear envelope disruption indicator compared to No Device control. Electroporation used as positive control. *P < 0.05, **P < 0.01, N = 3 (D) There is not a statistically significant correlation between nucleus size and nuclear envelope disruption. (E) Compressed cells exhibit NLS-GFP outside the nucleus in <10% of cells but is not statistically significant compared to No Device control. Electroporation used as positive control. *P < 0.01, N = 3. (F) Protein gel imaging shows device groups have very similar protein band intensity profiles to No device control. Cell lysate control group has much higher protein content.

