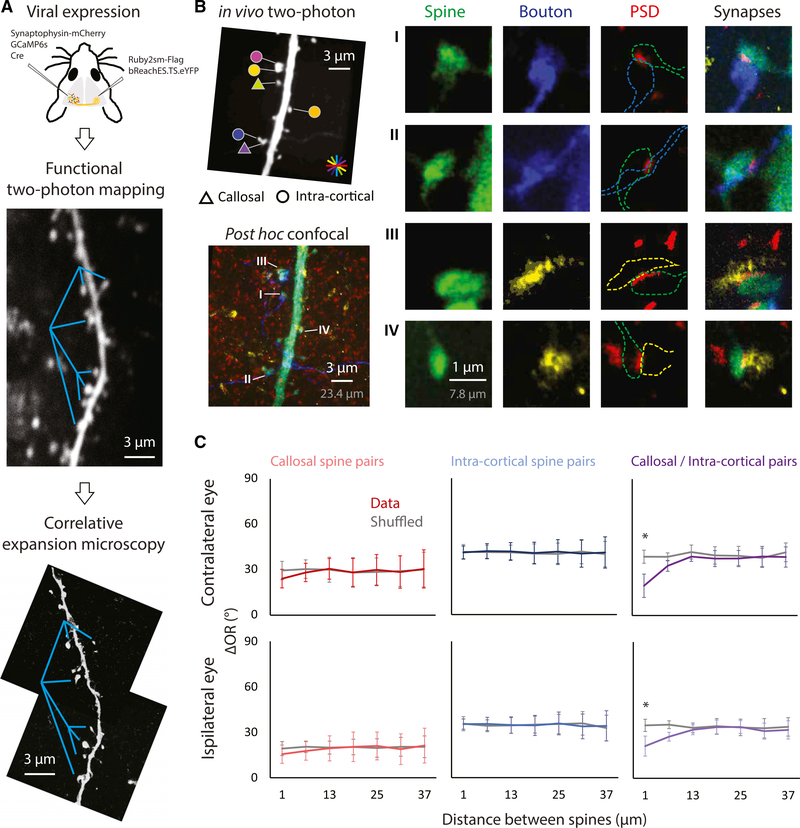
Figure 3. Functional Clustering Between the Callosal and Intra-Cortical Spine Pairs Supported with Anatomical Evidence of Monosynaptic Connections.
(A) The structural markers for callosal (Ruby2sm-Flag) and intra-cortical (synaptophysin-mCherry) axonal terminals were expressed through a viral approach. The same dendritic segment that underwent functional mapping was reimaged with confocal microscopy post-tissue expansion. Cyan lines, references for comparison.(B) Left: the pictured dendritic segment was imaged after histological staining. Fluorophores targeted callosal axons (blue), intra-cortical boutons (yellow), dendritic spines (green), and postsynaptic densities (red). Right: four example spines receiving callosal (top two) or intra-cortical (bottom two) synaptic inputs. Scale bars are provided both in physical size post-expansion (gray) and back-calculation with expansion factor (white).(C) The relationship of the distance between spines in a pair and orientation preference is analyzed in a similar way as in Figure 2. Consistent with results from high-throughput CRASM, callosal spines are more likely to cluster with the intra-cortical spines with similar orientation preference (n = 131 callosal spine pairs; n = 923 intra-cortical spine pairs; n = 298 callosal/intra-cortical pairs, 52 dendrites, 6 mice). Error bars represent SEM. *p < 0.001, permutation test.

