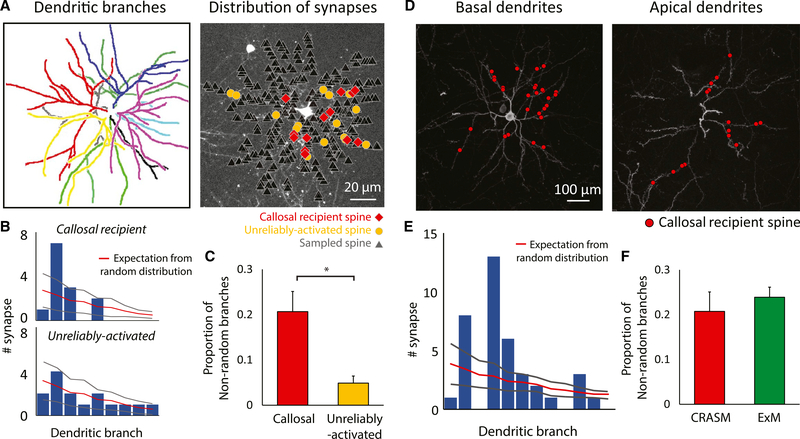
Figure 4. Non-random Distribution of Callosal Inputs on Dendrites.
(A) Left: different primary dendritic branches labeled by color. Right: callosal-recipient (red) and unreliably activated (yellow) spines derived from optogenetic synaptic mapping are highlighted amongst the total spines recorded in the imaging experiment with CRASM.(B) Comparing the experimentally derived distribution of spines on dendritic branches to the random distribution of the example cell. The bar plot shows the number of synapses on each dendritic branch (sorted according to their surface area from high to low), while the overlaid red line indicates the number of synapses expected in a Poisson distribution. Gray lines indicate ±2 SD.(C) The proportion of dendritic branches receiving a significantly biased number of reliably activated inputs (callosal) is significantly higher than ones receiving a significantly biased number of unreliably activated inputs. Error bars represent SEM. *, P=0.00812, Wilcoxon rank sum test; n = 12 cells, 12 mice.(D) Dendritic distribution of callosal synapses in the basal dendrites (left) and apical dendrites (right) defined by expansion microscopy.(E) Comparison of the experimentally derived distribution of callosal-recipient spines on dendritic branches to the random distribution. Gray lines indicate ±2 SD.(F) Results from anatomical mapping using expansion microscopy are not statistically different from results using optogenetic synaptic mapping. Error bars represent SEM. p = 0.545, Wilcoxon rank sum test; n = 8 cells, 4 mice for ExM experiment.

