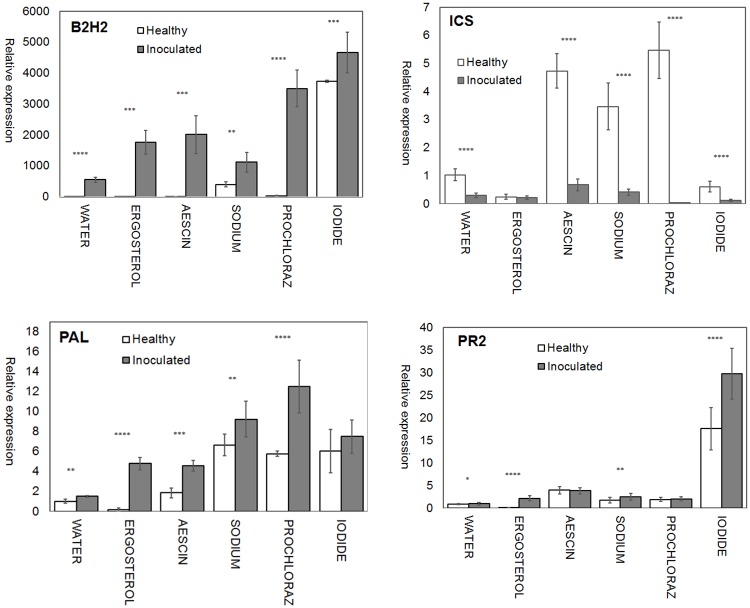
Fig 3. Expression profiles of B2H2, ICS, PAL, and PR2 in leaves of inoculated and healthy plants of wheat variety Bohemia under different treatment conditions (A, B, C, D).
Expression levels were relative to healthy cv. Bohemia seeds and were normalized with the wheat reference gene GAPDH. Expression levels shown are mean values and standard deviation for three replications. Statistically significant differences between healthy and inoculated cv. Bohemia plants are indicated by asterisks above every treatment (P < 0.05 (*); P < 0.01 (**); P < 0.001 (***); P < 0.0001 (****).

