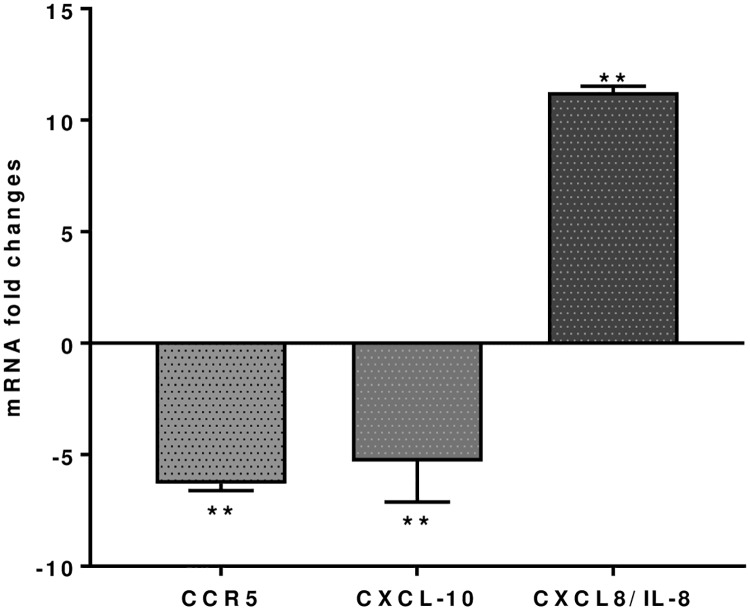
Fig 4. CCR5, CXCL10 and CXCL8 (IL-8), mRNA fold change following 24 h co-culture of S. thermophilus 285 with PBMCs (n = 3), compared to control PBMC.
The innate and adaptive RT2 gene profiler arrays were used to determine changes in gene expression. Symbols represent p value for Tukey Test (One way ANOVA) where ** p < 0.04.

