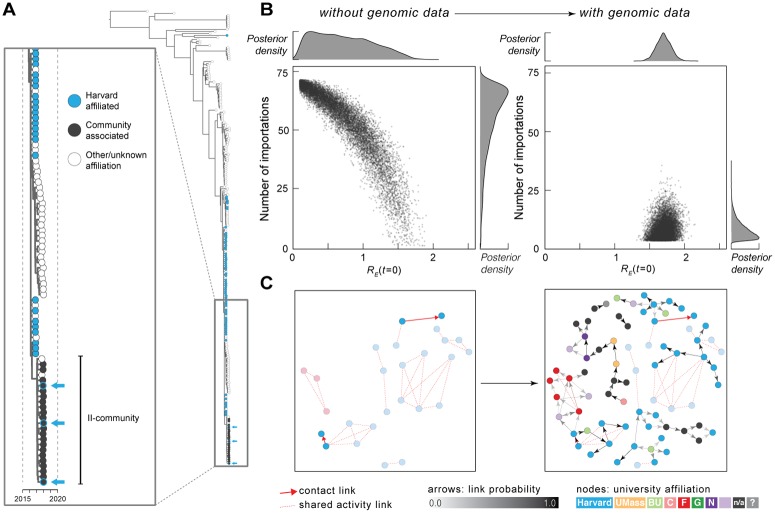
Fig 2. Epidemiological modeling and transmission reconstruction.
(A) Zoom view of Clade II-community and its ancestors (see Fig 1A). Arrows: individuals affiliated with both II-community and Harvard. (B) Number of importations into Harvard calculated without (left) and with (right) viral genetic information as input. Each point represents a sample from the posterior distribution of RE(t = 0) and the number of introductions, based on simulated transmission dynamics. (C) Transmission reconstruction of individuals within Clade II-outbreak; samples are colored by institution affiliation (light purple: other institution; n/a: no affiliation; question mark: unknown affiliation). Left: reconstruction using epidemiological data only; all individuals in Clade II-outbreak with known epidemiological links (red arrows) are shown. Right: reconstruction using mumps genomes and collection dates. Arrow shading indicates probability of direct transmission between individuals (minimum probability shown: 0.3); cases with 1 or more inferred links are shown and are colored by institution. Arrows outlined in red represent transmission events identified by both genomic and epidemiological data. Faded nodes are those only connected by shared activity links (i.e., no inferred or known direct transmission). BU, Boston University; Harvard, Harvard University; RE, effective reproduction number; UMass, University of Massachusetts Amherst.

