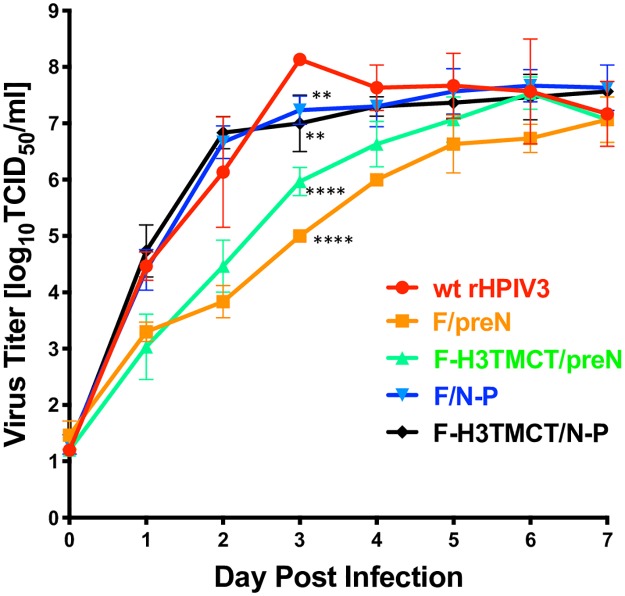
Fig 3. Multistep growth curve of rHPIV3 vectors expressing RSV F.
Vero cells were infected in triplicate with an MOI of 0.01 TCID50/cell of the indicated viruses. Cells were incubated at 32°C and aliquots of culture medium were collected at 24 h intervals over 7 days and replaced by equal volumes of fresh medium. Samples were flash frozen and at a later time virus titers were determined in parallel by limiting dilution on LLC-MK2 cells using an hemadsorption assay, and are reported as log10TCID50 per mL. Mean titers are shown with the standard deviations indicated as vertical error bars. The statistical significance of the differences between the vectors expressing RSV F versus wt rHPIV3 empty backbone on day 3 and 7 post-infection was determined by one-way analysis of variance with Tukey’s multiple-comparisons post-test and are indicated by ** (P<0.01) and **** (P<0.0001).

