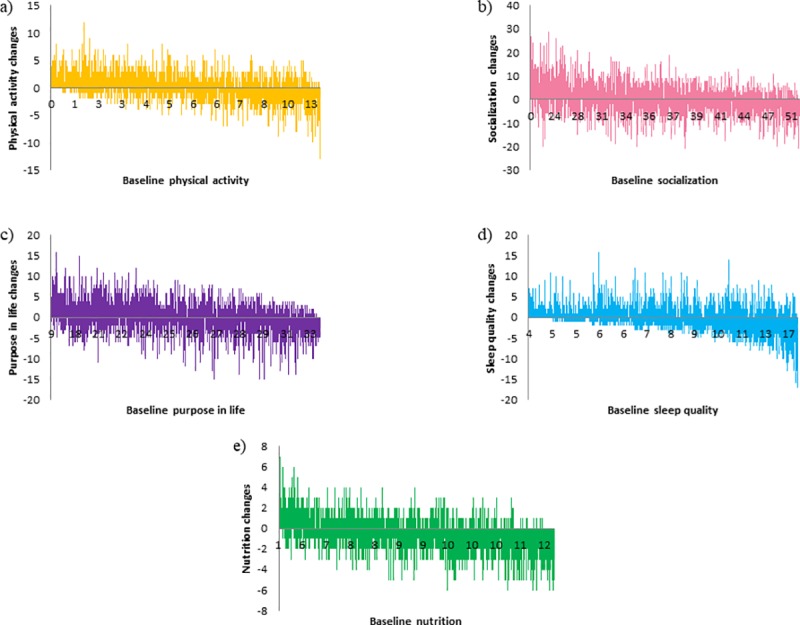
Fig 7.

In the x axis of the waterfall plot baseline scores are reported and in the y axis changes between baseline and the follow-up are reported in the different domains: a) physical activity, b) socialization, c) purpose in life, d) sleep and e) nutrition.
