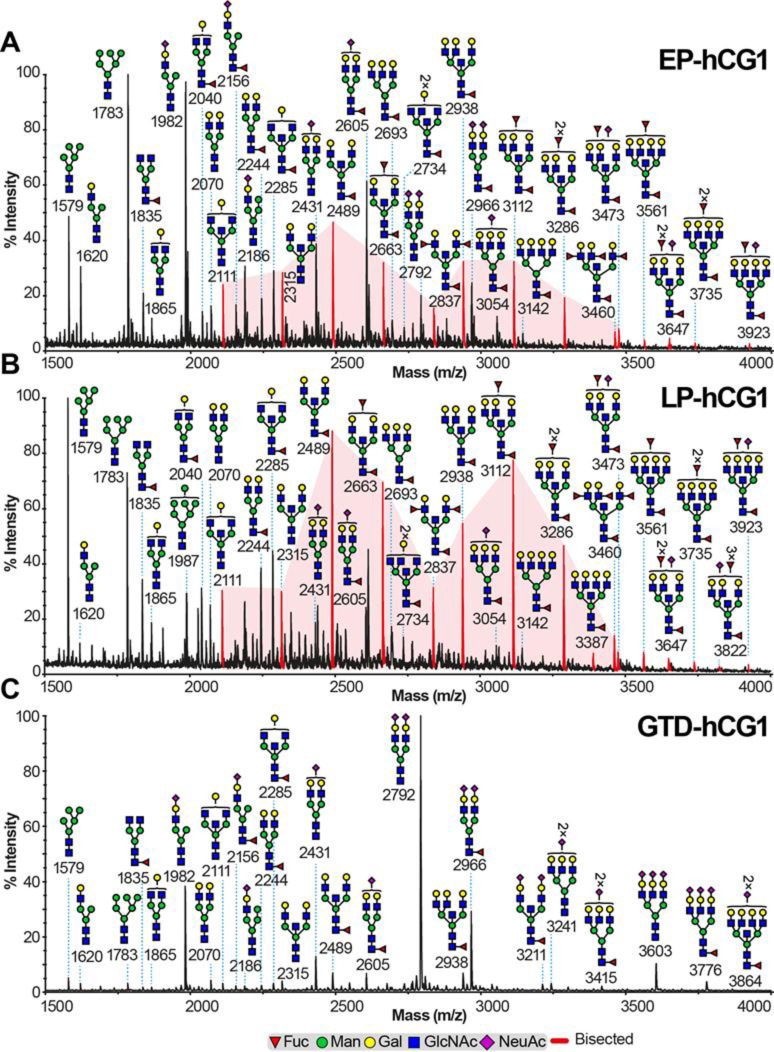
Fig 1. N-glycomic profiles of hCG samples from normal pregnancy and GTD.
MALDI-TOF MS spectra of permethylated N-glycans derived from (A) EP-hCG1, (B) LP-hCG1 and (C) GTD-hCG1 samples. Structures above a bracket were not unequivocally defined. Red peaks correspond to bisected N-glycans with various antenna configurations. Putative structures are based on composition, tandem MS, β-galactosyltransferase experiment and knowledge of biosynthetic pathways. All molecular ions are [M+Na]+. MALDI-TOF MS spectra of other hCG samples are shown in S1 Fig.

