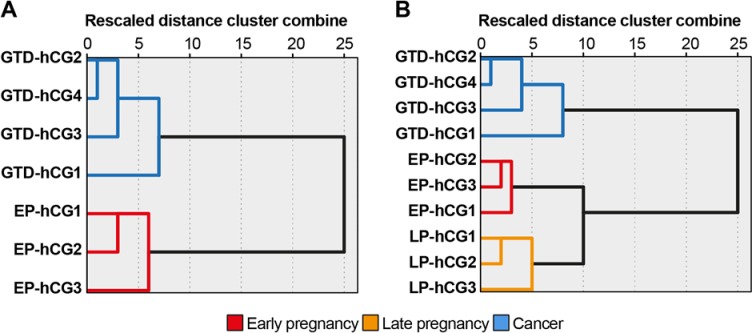
Fig 3. Hierarchical cluster analysis of hCG samples.
(A) Hierarchical cluster analysis of EP-hCG and GTD-hCG samples using as clustering variables the total relative abundance of the structural features that were significant at the P < 0.05 level (after correction for multiple comparison with Bonferroni test) as found from independent t-test and shown on Fig 2. The variables bisected and core-fucosylated N-glycans, and LacNAc, NeuAc and LewisX terminal epitopes. (B) Hierarchical cluster analysis of all hCG samples (EP, LP and GTD) using as clustering variables the total relative abundance of bisected N-glycans and NeuAc terminal epitopes. For hierarchical cluster methods, see materials and methods.

