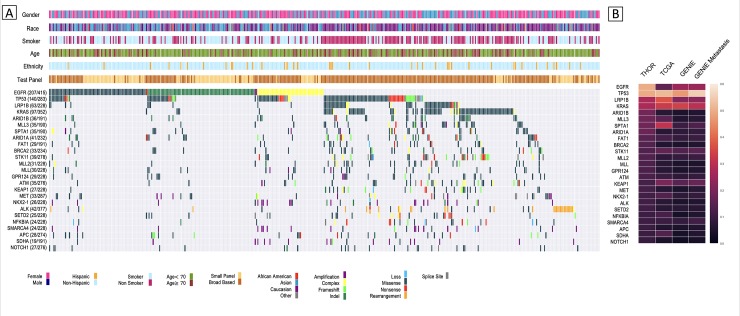
Fig 1. Landscape overview of molecular profiling in 415 THOR lung adenocarcinoma patients.
A) Tile plot of top 25 most prevalent genes and their demographic parameters sorted by genomic alteration rate and subtypes, including amplification, complex (more than one type of alteration), frameshift, indel (insertion/deletion), loss, missense, nonsense, rearrangement, and splice site. For each gene, the alteration rate was calculated by number of patients with alteration divided by the number of patients tested for this gene. B) Heatmap showing a comparison of the genomic alteration rates between THOR, TCGA, GENIE, and GENIE Metastatic for genes in 1A.

