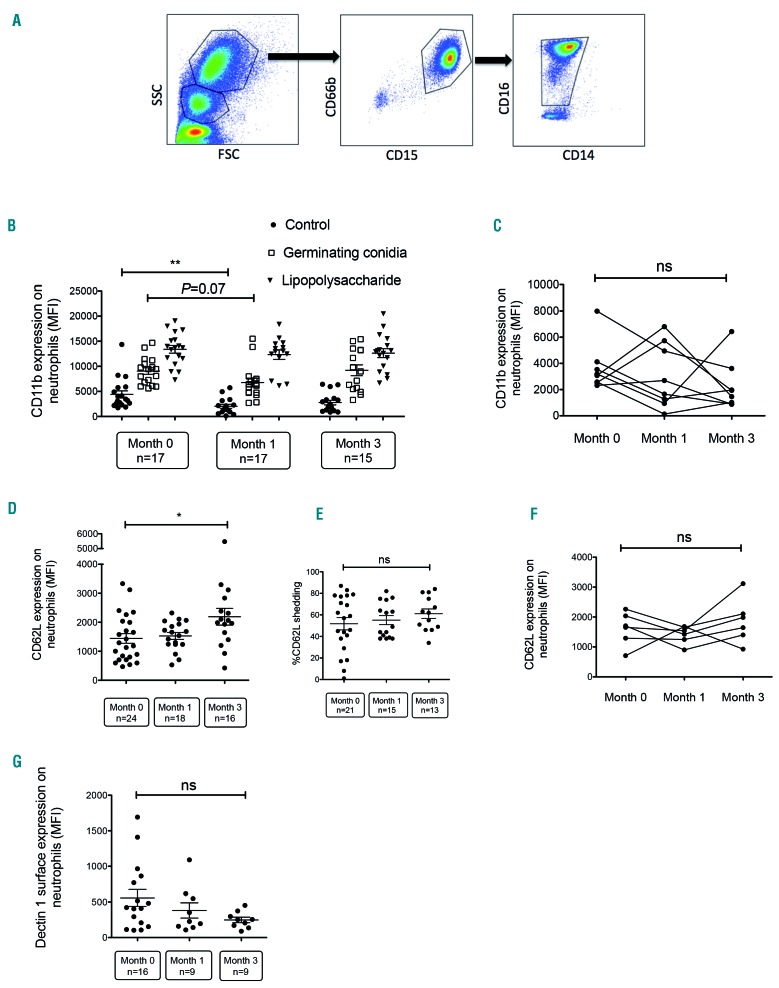
Figure 1.
Effect of ibrutinib on CD11b, CD62L and Dectin-1 expression on neutrophils. (A) Representative fluorescence-activated cell-sorted plots: neutrophils were gated according to size and granularity by forward (FSC) vs. side scatter (SSC) properties and as CD66b+, CD15+, CD16+/low, CD14- cells. (B) Neutrophil surface expression of CD11b in samples of whole blood taken from patients before starting ibrutinib therapy, and 1 month and 3 months after initiation of ibrutinib therapy, as assessed by flow cytometry. Blood samples (500 μL) were incubated for 2 h without stimulation (phosphate-buffered saline) or after stimulation with 106 germinating Aspergillus conidia or bacterial lipopolysaccharide plus formyl-methionine-leucyl-phenylalanine. (C) Paired analysis of CD11b surface expression in neutrophils collected from eight patients at different time points during ibrutinib therapy. (D, E) Neutrophil surface expression of CD62L in whole blood samples from patients before ibrutinib therapy, 1 month after starting ibrutinib treatment, and 3 months after initiation of ibrutinib therapy, as assessed by flow cytometry. The percentage of CD62L shedding was determined after stimulation with germinating conidia compared with non-stimulated cells. (F) Paired analysis of CD62L surface expression in neutrophils collected from six patients at different time points during ibrutinib therapy. (G) Neutrophil surface expression of Dectin-1 in whole blood taken from patients before ibrutinib therapy, 1 month after treatment initiation and 3 months after initiation of ibrutinib therapy, as assessed by flow cytometry. Long bars represent the mean fluorescence intensity (MFI), and short bars represent the standard error of the mean. Multiple groups were analyzed using the Kruskal-Wallis test with the Dunn multiple comparison post-test. Paired data were analyzed using the Friedman test. *P<0.05; ** P<0.01; ns: non-significant.

